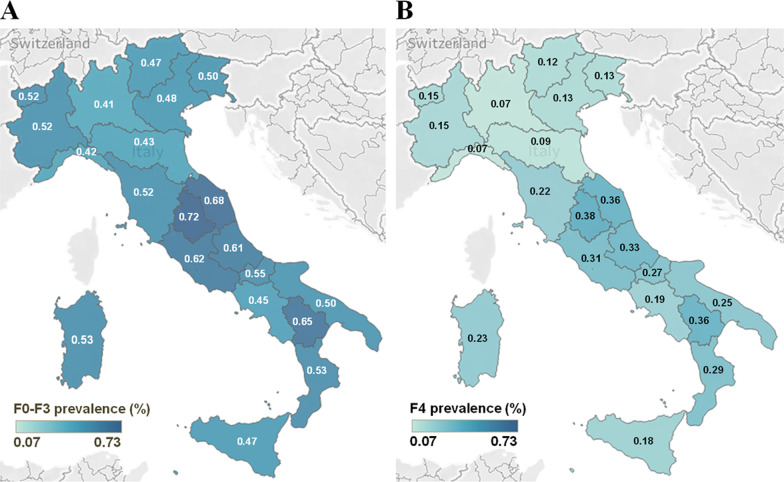
Fig. 2.
Maps of the estimated prevalence of HCV in different regions of Italy. A The prevalence of potentially undiagnosed individuals with HCV (stage F0–F3) and B individuals with HCV (stage F4 liver fibrosis; potentially diagnosed) are depicted in the two maps. Prevalence estimates were calculated according to each of the region’s population by age group annually since 1952 up to January 1, 2020, from the Italian National database (ISTAT) [14]. F0–F3 = asymptomatic; undiagnosed/unlinked to care; F4 = symptomatic; potentially linked to care and cure; HCV = hepatitis C virus. Please note that when referring to prevalence values for a given area (e.g. a region or a macroarea) we refer to the percentage of individuals located in that macro area that are infected

