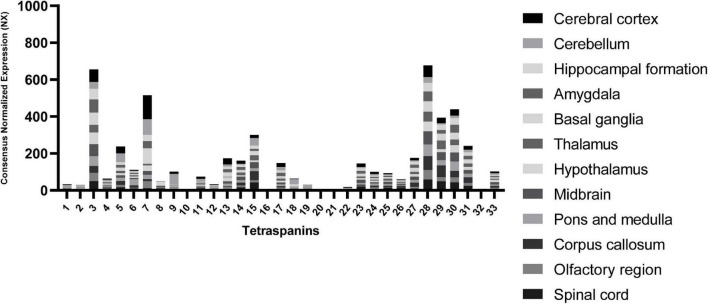
FIGURE 2.
RNA expression levels of tetraspanins in different regions of the brain. Consensus Normalized eXpression (NX) levels shown are created by combining the data from three transcriptomics datasets (HPA, GTEx, and FANTOM5) using normalization pipeline. Each bar contains combined data of all brain regions indicated. Data used to compose the graph obtained from the Human Protein Atlas database (proteinatlas.org).

