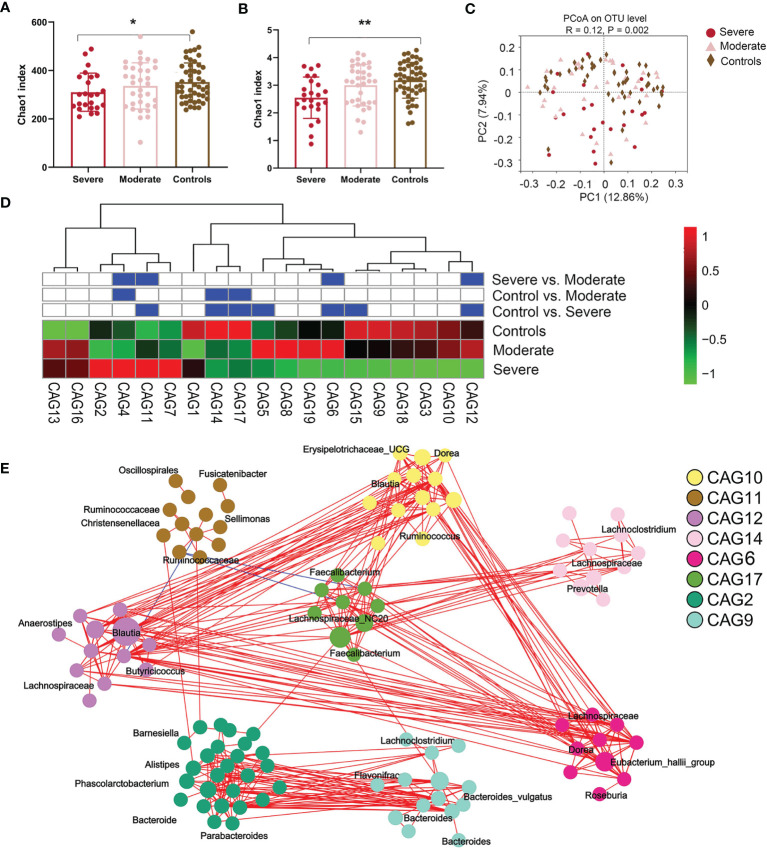
Figure 2.
The fecal microbiota from anti-N-methyl-d-aspartate receptor (NMDAR) encephalitis patients with more severe status are distinct from those of healthy controls. (A, B) Comparison of the Chao 1 (A) and Shannon (B) indices between the different disease severity groups and healthy controls. A significantly decreased intestinal microbiota diversity in NMDAR encephalitis patients with more severe disease status was found. The mean values and standard deviations are presented as bars. *p < 0.05, **p < 0.01. P-values are from the Kruskal–Wallis test. (C) The overall bacterial signatures between the three groups were markedly different (unweighted Unifrac, PERMANOVA: p = 0.003). (D) Abundances of the 19 co-abundance groups (CAGs) in various NMDAR encephalitis severity subgroups. Abundances were transmuted into Z scores by subtracting the average abundances and dividing the standard deviations for all samples. Z scores were negative (shown in green) when row abundance was below the mean. CAGs at p < 0.05 (by Wilcoxon rank-sum test) are shown in blue. (E) Operational taxonomic unit (OTU)-level diagram for the enrichment of OTUs in various groups based on the markedly altered CAGs. Node size denotes the mean abundance of each OTU. Bacteria denoted on nodes were of the lowest classification status that could be identified by the RDP classifier. Lines between nodes denote associations, with line width showing association magnitudes, red denotes positive association, and blue denotes negative associations. Lines corresponding to associations with magnitudes >0.4 were drawn.

