Figure 3.
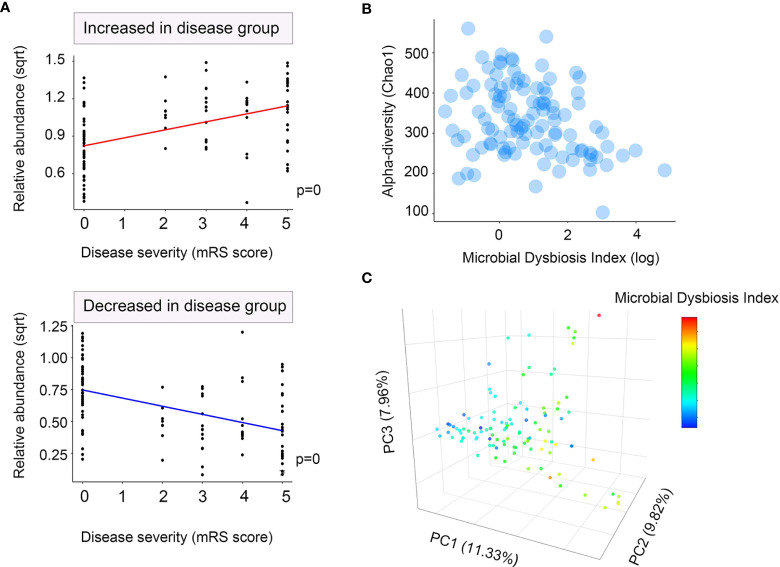
Microbial dysbiosis index (MD-index) characterizing anti-N-methyl-d-aspartate receptor (NMDAR) encephalitis severity. (A) Scatter plot of arcsine square root transmuted abundance for all summed abundances for the taxa decreased (bottom) or increased (top) in patients with NMDAR encephalitis versus the modified Rankin scale (mRS) score as a disease severity measure. (B) Scatter density plot for species richness vs. the MD-index for each sample. In samples with a high MD-index, a strong reduction in the species richness was observed. (C) Principal coordinate plot for unweighted UniFrac distance, colored using the MD-index. It can be noticed that the three principal coordinates stratified the samples by MD-index, which exhibited negative correlations with species richness. Sqrt, square root.

