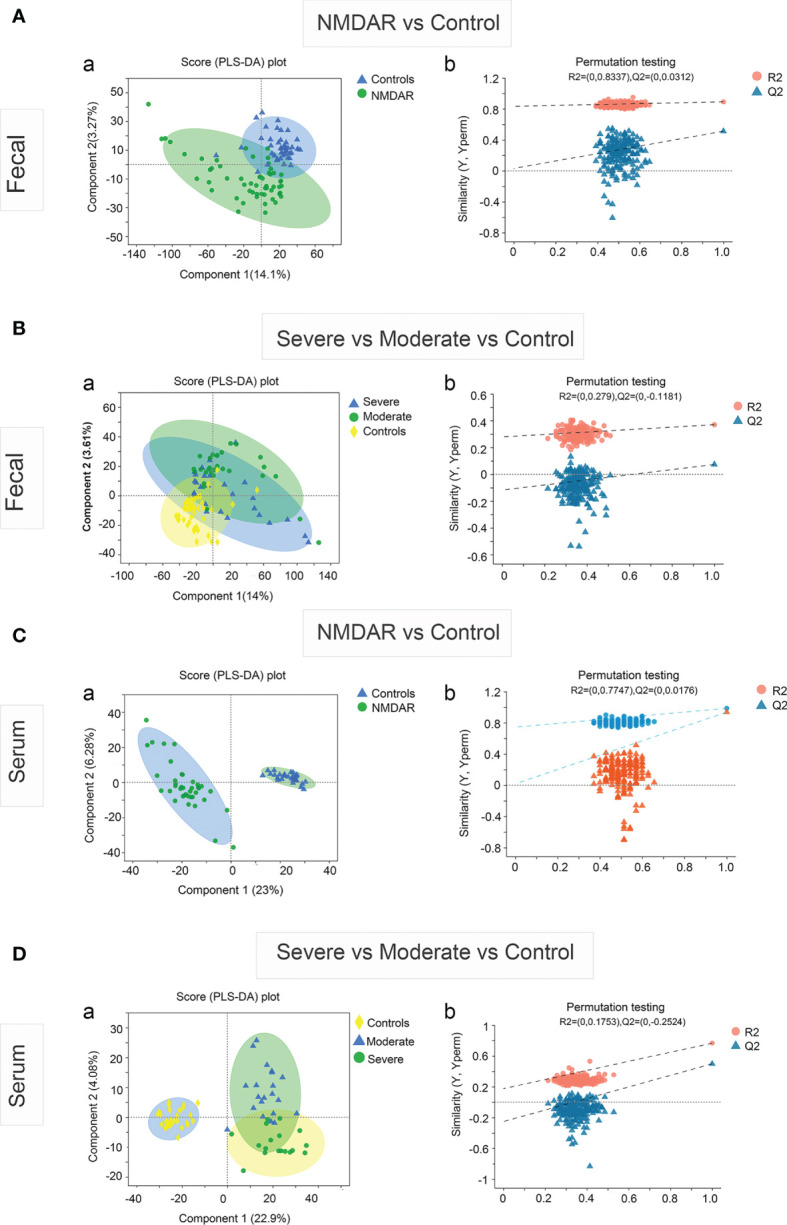
Figure 4.

Partial least squares discriminant analysis (PLS-DA) of the fecal and serum metabolomes in anti-N-methyl-d-aspartate receptor (NMDAR) encephalitis cases versus healthy controls. Fecal (A) and serum (C) metabolomics PLS-DA score plot of NMDAR encephalitis cases (blue) vs. controls (green). Each dot denotes an individual subject. Permutation test for the PLS-DA model: 999 permutations led to intercepts of R 2 = 0.833, Q2 = 0.03 (fecal) and R 2 = 0.774, Q2 = 0.017 (serum), implying an acceptable model minus overfitting. Fecal (B) and serum (D) metabolomics PLS-DA score plot of NMDAR encephalitis cases with severe status (blue) and moderate status (green) versus controls (yellow). Each dot represents an individual subject. PLS-DA model permutation test: 999 permutations led to intercepts of R 2 = 0.279, Q2 = −0.118 and R 2 = 0.175, Q2 = −0.252, implying an acceptable model minus overfitting.
