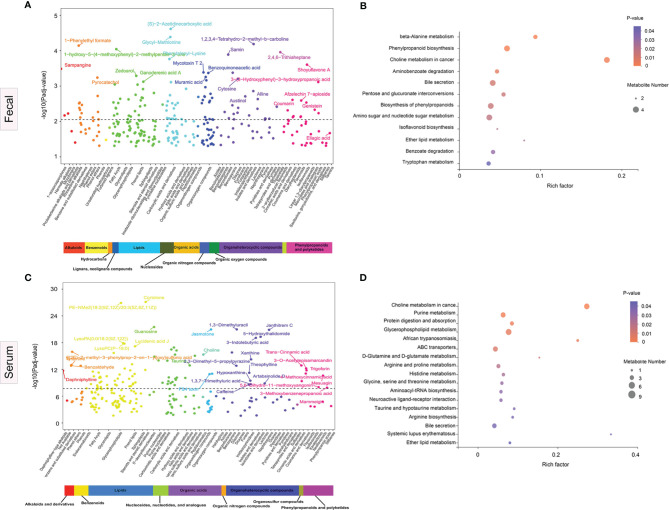
Figure 5.
Significance plot for the adjusted selected differential metabolites in anti-N-methyl-d-aspartate receptor (NMDAR) encephalitis cases vs. healthy controls by sub- and super-pathway level. (A, C) Each significantly selected fecal (A) and serum (C) metabolites sub-pathway is represented. The −log10(P adj) for each metabolite is displayed by respective sub- and super-pathway (P adj, adjusted p-value). Unadjusted Wilcoxon rank-sum test p-values were adjusted for multiple comparisons using Benjamini–Hochberg (BH) correction to yield adjusted p-values. The dashed line represents the adjusted p-value. Asterisks represent compounds that were not verified against a standard, but whose identity the analytical platform was confident in. (B, D) Significantly enriched sub-pathways from metabolites selected using partial least squares discriminant analysis (PLS-DA) models are illustrated in dot plots. Each significantly selected fecal (B) and serum (D) sub-pathway is denoted by a circle described by three parameters. Circle size shows how many of the metabolites were selected in the sub-pathway (see legend in gray to the right of the plot for relative sizes). Circle shades from light pink to red denote selected sub-pathway significance levels based on −log10(p-value) (see legend to the right of the plot for relative color gradient). Sub-pathways were markedly enriched if p < 0.05, which was comparable to −log10(p-value) > 1.3. Circle position along the rich factor axis shows the abundance of the selected metabolites from the sub-pathway against all sub-pathway metabolites.

