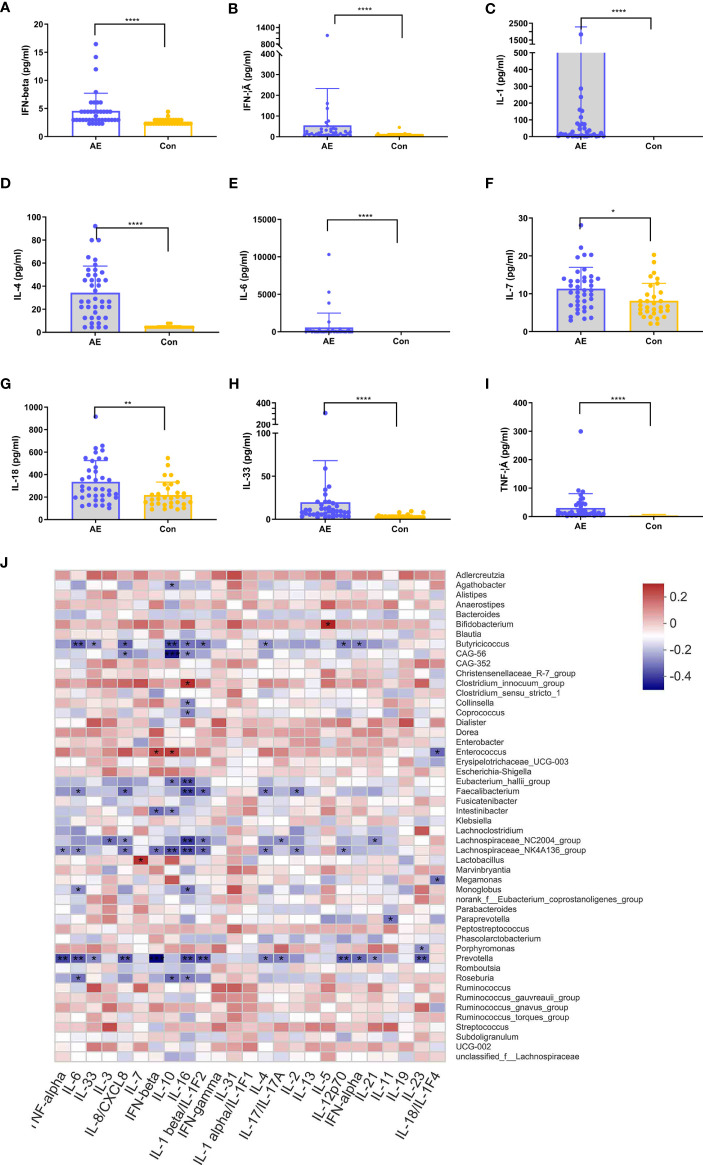
Figure 6.
Correlation between dysregulated cytokines and differential genera in anti-N-methyl-d-aspartate receptor (NMDAR) encephalitis. (A–I) Analysis of 12 immune cytokines in patients with NMDAR encephalitis and in healthy controls (HCs). Participants’ sera were run on Luminex. Differences are determined by a t-test. (J) Correlation analyses of cytokines and differentially enriched genera between any two groups. Abundance rates of differentially enriched species (top 30) in HCs and NMDAR encephalitis were evaluated for association with differential immune factors using Spearman’s correlation analysis. Correlations are shown by color gradients from green (negatively correlated) to purple (positively correlated). Correlation coefficients and p-values (*p < 0.05, **p < 0.01, ***p < 0.001, **** p < 0.0001) are shown.

