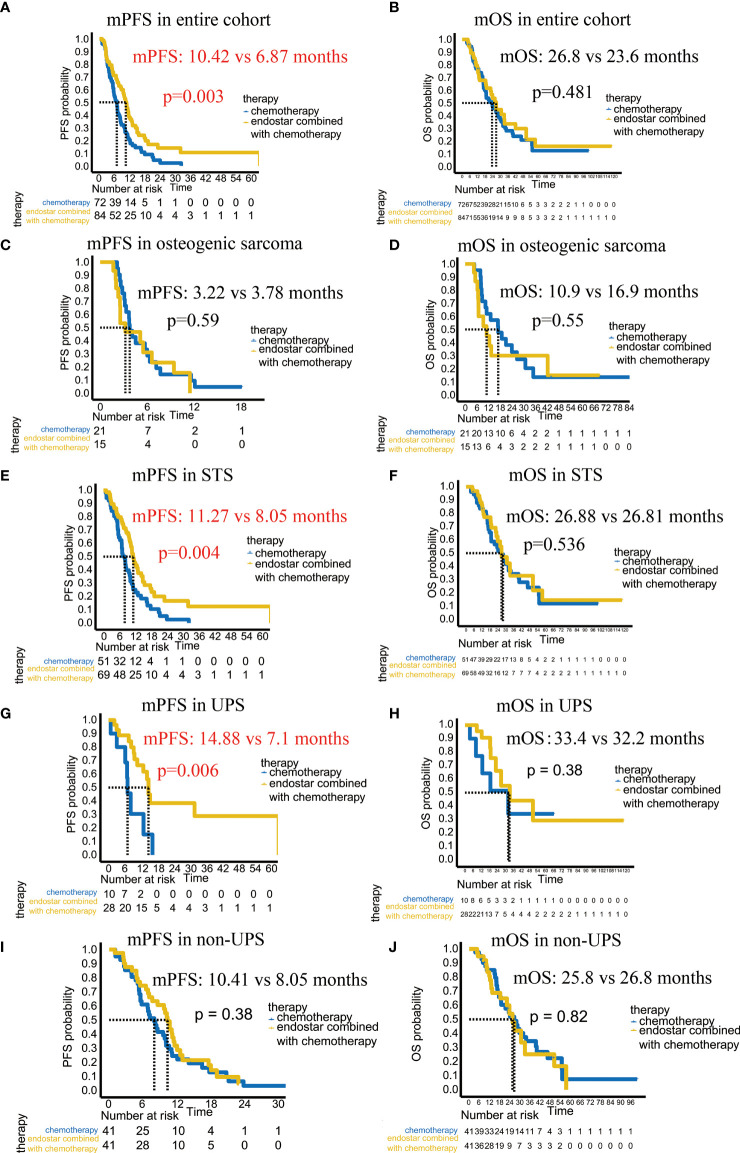
Figure 3.
Comparison of the mPFS and mOS between the Endostar combined chemotherapy group and chemotherapy group. (A) Comparison of the mPFS in the entire cohort. (B) Comparison of the mOS in the entire cohort. (C) Comparison of the mPFS in patients with osteogenic sarcoma. (D) Comparison of the mOS in patients with osteogenic sarcoma. (E) Comparison of the mPFS in patients with soft tissue sarcoma. (F) Comparison of the mOS in patients with soft tissue sarcoma. (G) Comparison of the mPFS in patients with UPS. (H) Comparison of the mOS in patients with UPS. (I) Comparison of the mPFS in patients with non-UPS. (J) Comparison of the mOS in patients with non-UPS.

