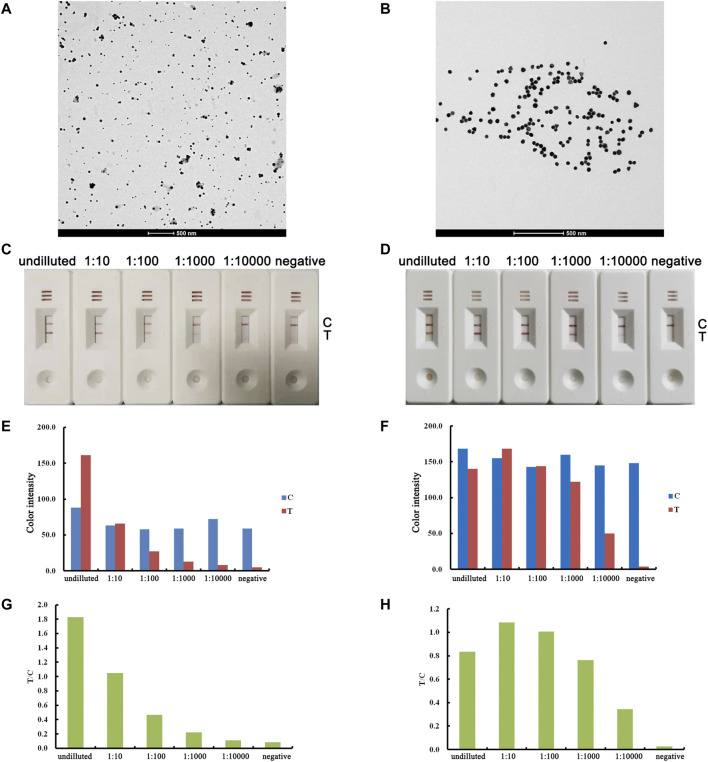
FIGURE 2.
Optimization of the AuNP label. The results for traditional AuNPs are shown in the left column, and the results for ultrauniform AuNPs are shown in the right column. TEM images of AuNPs (A, B). Real detection figures of sensitivity analysis of ASFV antibody by lateral flow assay (C, D). The color intensity values of the test line (T value) and control line (C value) of the lateral flow assay (E, F). The T/C value of lateral flow assay (G, H).

