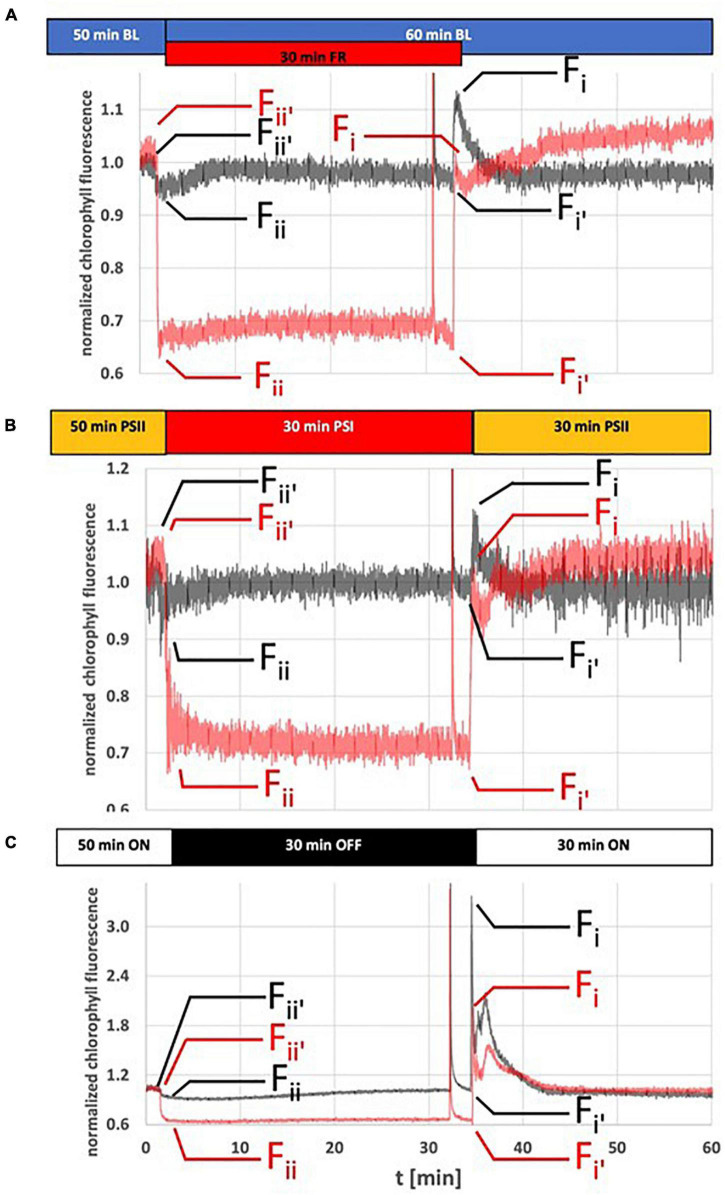
FIGURE 1.
Dynamics of Chl fluorescence changes in response to light quality or dark-light shifts. Arabidopsis WT plants (gray traces) and stn7 mutants (red traces) were grown for 14 days under LD conditions and then used for Chl fluorescence measurements using a pulse amplitude modulated fluorometer. (A) Reference measurement using internal LED based light sources of the measurement device for induction of state transitions. (B) Chl fluorescence changes caused by shifts between the PSI- and PSII-light sources at equal PAR. (C) Chl fluorescence changes caused by dark-white light shifts. Duration of and shifts in illumination are indicated by horizontal bars on top of the fluorescence traces. All experiments started with a 60 min dark-adaptation followed by the light regime indicated in the figure. A saturation light pulse was given 2 min before a change in light condition. Only the pulse in state 1 is visible at this magnification of the figure. Fii′, Fii, Fi′, and Fi values were taken at indicated time point (small arrows) in order to calculate Fr according to the protocol by Haldrup et al. (2001). Chl fluorescence is given as normalized values. The figure depicts representative results. Each experiment was repeated at least three times with three different biological samples. For understanding of Chl fluorescence nomenclature compare legend of Table 2. Full data sets for all graphs including a full representation of saturation light pulses are available in Supplementary Figure S2.

