
FIGURE 2.
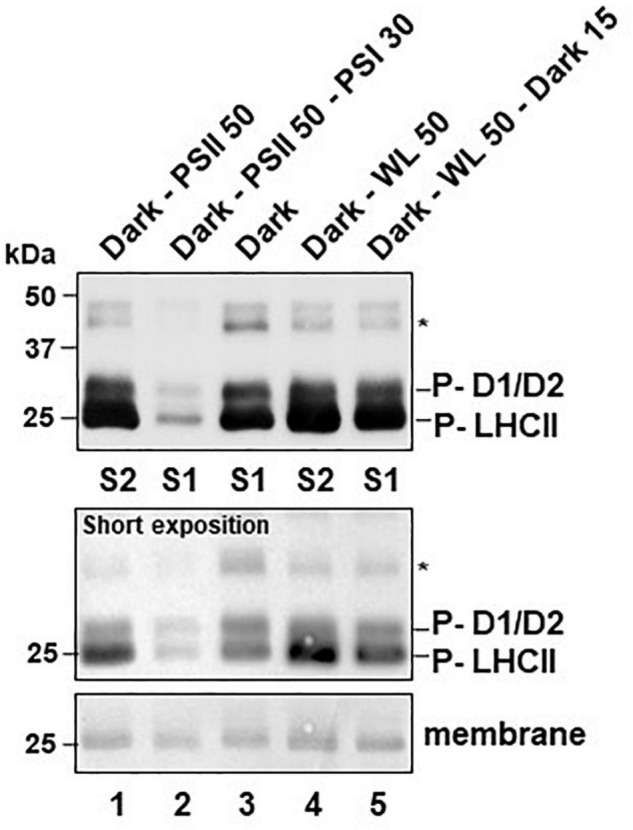
Effects of light-quality or dark-white light shifts on phosphorylation state of thylakoid membrane proteins. Isolated thylakoid protein samples corresponding to 20 μg total chlorophyll were separated by SDS-PAGE. For detection of phosphorylation state proteins were transferred to a nitrocellulose membrane via western blot and immuno-decorated using an anti-phospho-threonine antiserum (Cell Signaling Technologies). Labeling was done according to published work (Fristedt et al., 2009; Samol et al., 2012). This phospho-immuno-detection was done once to confirm the state transition results from the Chl fluorescence data and produced results that are in full accordance to earlier studies. A comprehensive statistical treatment of data including triplicate independent biological repetitions, therefore, was regarded as negligible. Relative changes in signal intensities can be sufficiently estimated by comparison to the loading controls given by the respective amido-black stained membranes at the migration front of LHCII trimers (membrane). Additional loading controls are given in Supplementary Figure S3. Sizes of marker proteins are given in the left margins in kDa. Signals from phosphorylated CP43 (labeled by asterisk) and another unidentified protein were very weak requiring long exposition times to be visualized. Signals from phosphorylated D1, D2 and LHCII (P-D1/D2, P-LHCII) were reaching saturation under such conditions and a second short exposition time of the same membrane is given (short exposition) as control. All plants were grown for 2 weeks under LD conditions and treated as indicated before sampling. Dark-PSII 50: 50 min PSII-light after dark. Dark-PSII 50–PSI 30: 50 min PSII-light after dark followed by 30 min of PSI-light. Dark: Control at the end of the last dark period. Dark-WL 50: 50 min WL after dark. Dark-WL 50 - Dark 15: 50 min WL after dark followed by 15 min dark. The respective state induced by the illumination program is indicated at the bottom (S1: state 1; S2: state 2).