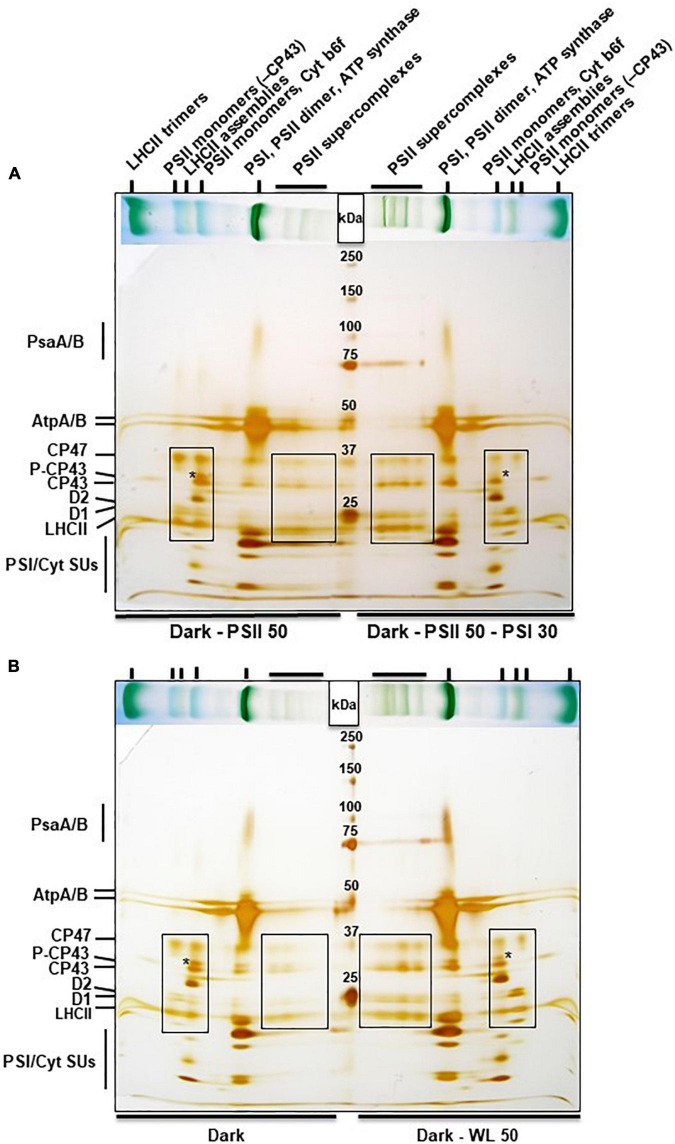
FIGURE 4.
2D BN-PAGE of thylakoid membrane proteins from A. thaliana subjected to light quality or dark light shifts. Stripes from BN-PAGE (placed horizontally on top of gels, compare Figure 3) were cut out, denatured in Laemmli buffer and run on a SDS-PAGE as second dimension with a head-to-head orientation. Marker proteins (sizes are given in kDa) were loaded in between. The gels were stained with silver. (A) Dark - PSII 50: 50 min PSII-light after dark period; Dark - PSII 50 - PSI 30: 50 min PSII-light after dark period followed by a shift for 30 min to PSI-light. (B) Dark: Material harvested at the end of the night phase; Dark - WL 50: 50 min WL illumination after dark phase. Labeling of bands in the BN-PAGE given on top of panel (A) is also valid for panel (B), corresponding bands are marked by vertical small lines. Individual protein bands in the second dimension are given in the left margins. Asterisks mark the position of phosphorylated CP43 (right or left from the asterisk, respectively). Broad boxed areas indicate subunits of PSII super-complexes, small boxed areas indicate subunits of PSII monomers. Experiments have been performed three times with results showing only minor variations. Continuous protein bands at 75 kDa in the right half of the gels are leakages from the protein marker.

