Figure 5.
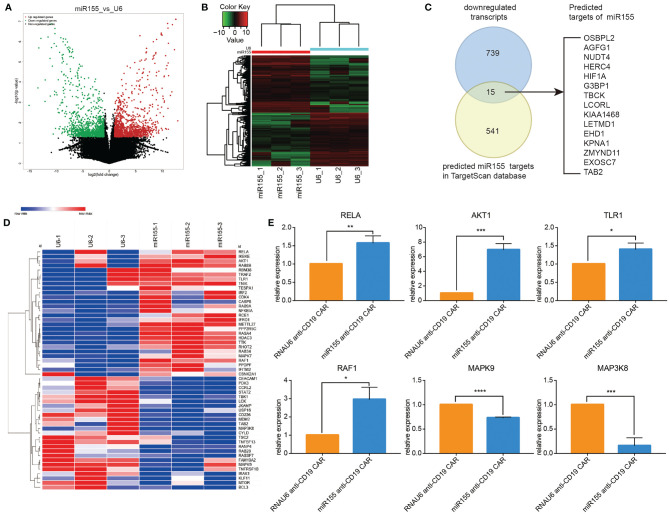
RNA sequencing revealed the miR155 targets in anti-CD19 CAR-T cells. (A) Volcano map of differential expression. (B) Cluster heat map of gene expression. (C) Predicted targets of miR155 in miR155 over-expressing anti-CD19 CAR-T cells. The Venn diagram showed the overlap between gene downregulated in miR155 over-expressing anti-CD19 CAR-T cells and predicted targets of miR155 in TargetScan dataset. (D) The cluster heat map of differential gene expression. (E) The verification of differential expression by RT-qPCR. Values were expressed as the means ± SD. Unpaired t test was performed. ***p<0.001, **p<0.01, *p<0.05 compared to RNAU6 anti-CD19 CAR-T cells.

