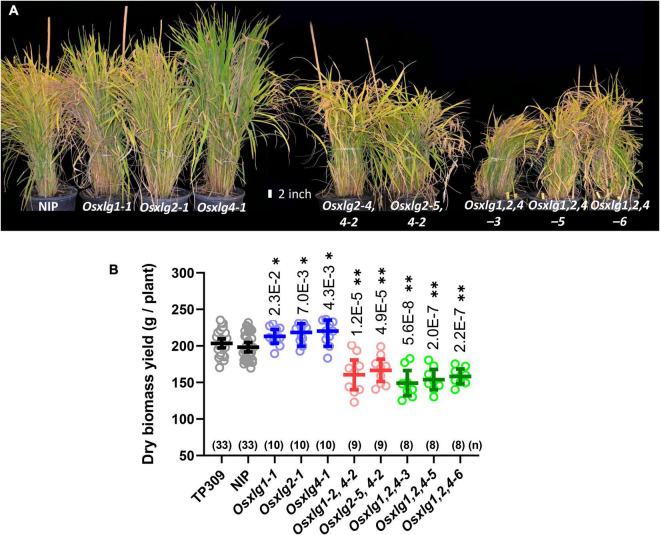
FIGURE 7.
Growth phenotypes and dry aerial weight of rice Osxlg plants. Growth phenotypes and dry aerial biomass weight of 125-day-old rice WT NIP, Osxlg single, double, and triple mutant greenhouse grown plants (A). The raw values of controls and Osxlg mutants are shown in (B). The horizontal lines indicate the means, the error bars represent 95% confidence intervals, and (n) is the sample size. Significant differences between WT-NIP and Osxlg mutants were determined by statistical analysis using Statistica 5.0 with one-way ANOVA followed by Tukey’s multiple comparison test. p-values are expressed as *P < 0.05, **P < 0.001.

