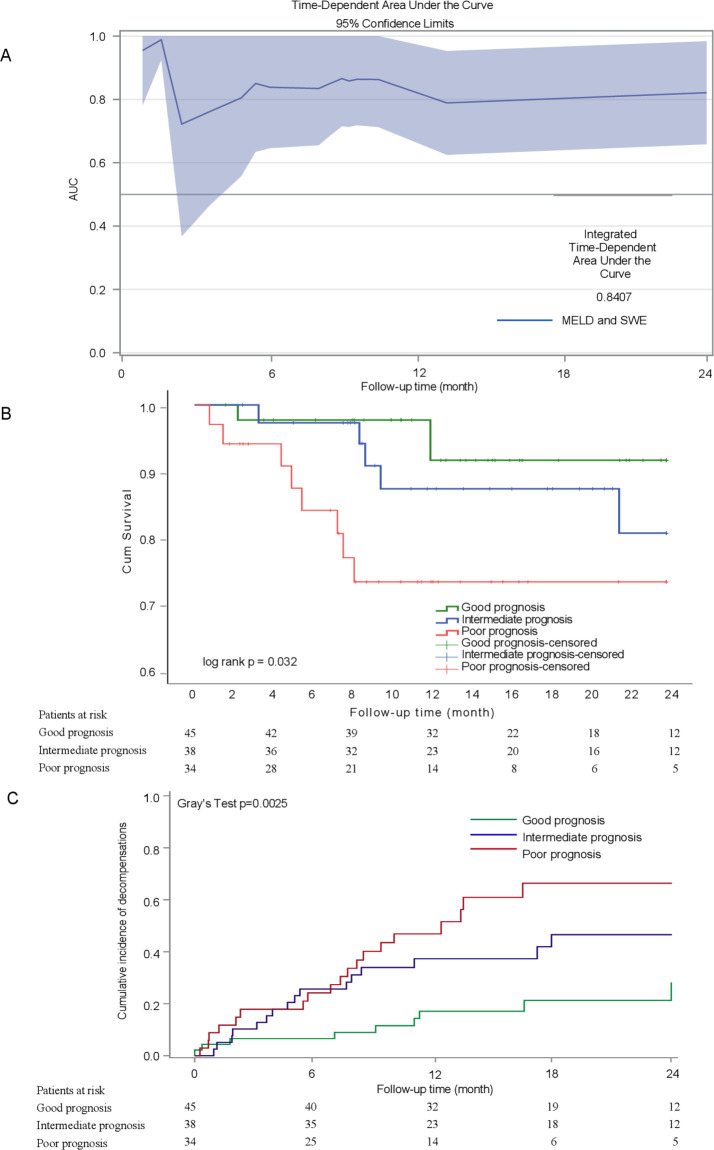
Figure 4.
(A) Time-dependent area under the curve and 95% CI of the combined model of MELD score and p-SWE in the additional cohort validated for p-SWE during 2 years of follow-up. (B) Two-year Kaplan-Meier curves of the additional cohort validated for p-SWE of patients classified with good, intermediate and poor prognosis. Level of significance: log-rank p<0.032. (C) Cumulative incidence of development of decompensations within 2 years of all patients included in the additional cohort validated for p-SWE with good, intermediate and poor prognosis. Level of significance: Gray’s test p=0.0025. AUC, area under the curve; MELD, model for end-stage liver disease; p-SWE, point shear wave elastography.

