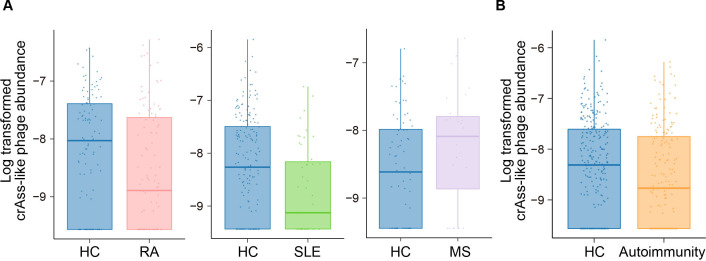
Figure 2.
Case–control comparison of the crAss-like phage abundance. (A) Case–control comparison of the crAss-like phage abundance for RA (left), SLE (middle) and MS (right). Boxplots indicate the median values (centre lines) and IQRs (box edges), with the whiskers extending to the most extreme points within the range between (lower quantile−(1.5×IQR)) and (upper quantile+(1.5×IQR)). (B) Case–control comparison of the crAss-like phage abundance for autoimmunity. Boxplots indicate the median values (centre lines) and IQRs (box edges), with the whiskers extending to the most extreme points within the range between (lower quantile−(1.5×IQR)) and (upper quantile+(1.5×IQR)). HC, healthy control; MS, multiple sclerosis; RA, rheumatoid arthritis; SLE, systemic lupus erythematosus.

