Figure 3.
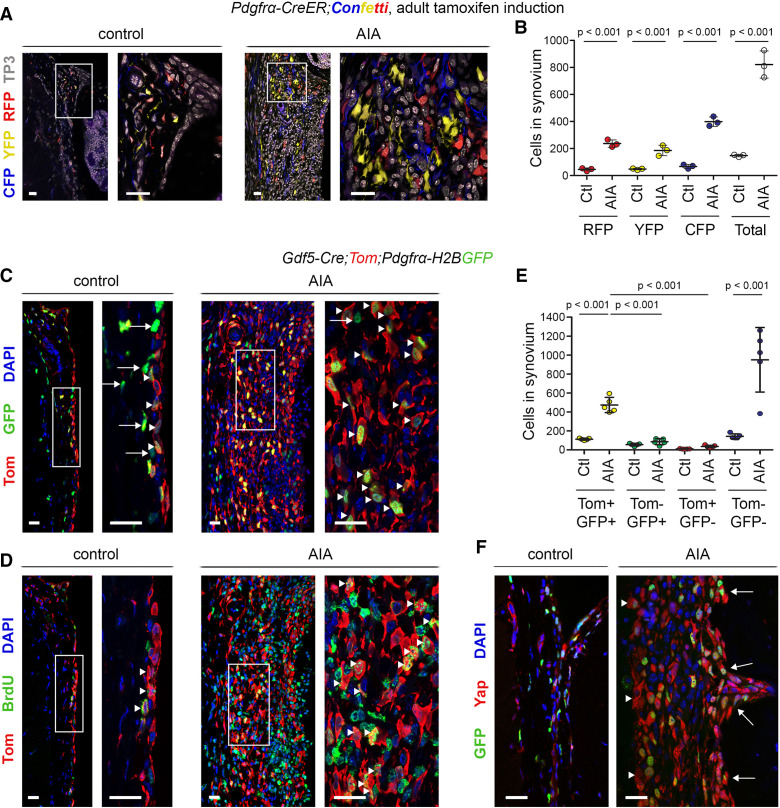
Pdgfrα-expressing Gdf5-lineage cells expand during inflammatory arthritis. (A, B) Detection of Pdgfrα-traced cells, marked by expression of CFP, YFP or RFP, in synovium of Pdgfrα-CreER;Confetti mice induced with tamoxifen from 8 weeks of age prior to AIA induction and analysed after 6 days of AIA (n=3; 3 male mice, 14–15 weeks). Contralateral knee served as control. (A) Cells labelled by CFP (blue), YFP (yellow) and RFP (red) in synovium. TO-PRO-3 (TP3) nuclear counterstain is shown in grey. (B) Numbers of CFP, YFP and RFP-labelled cells per mm length of synovium. P values indicate statistical significance based on two-way ANOVA with Tukey’s post-test after log transformation (n=3). (C–F) Gdf5-Cre;Tom;Pdgfrα-H2BGFP mice 6 days after AIA induction (n=5; 2 male mice, 3 female mice, 11–13 weeks). Mice received bromodeoxyuridine (BrdU) to label proliferating cells from arthritis induction until the end. (C, D) Expansion of Tom-labelled Gdf5-lineage cells (red) in synovium during AIA, co-staining for (C) GFP (green), indicative of Pdgfrα expression (arrowheads indicate Tom+GFP+ cells; arrows indicate Tom-GFP+ cells), or (D) the BrdU proliferation label (green; arrowheads indicate Tom+BrdU+ cells). Consecutive tissue sections are shown. For isotype negative control stainings, see online supplemental figure 10i, j. (E) Numbers of Tom-labelled and GFP-labelled cells per mm length of synovium. P values indicate statistical significance based on two-way ANOVA with Tukey’s post-test after log-transformation (n=5). (F) Detection of Yap (red) in GFP-expressing cells (green) in synovial lining (arrowheads) and along the periosteal surface (arrows). Scale bars: 20 µm. For isotype negative control stainings, see online supplemental figure 10k. Lines and error bars on all graphs indicate mean±SD. AIA, antigen-induced arthritis; ANOVA, analysis of variance.

