Figure 4.
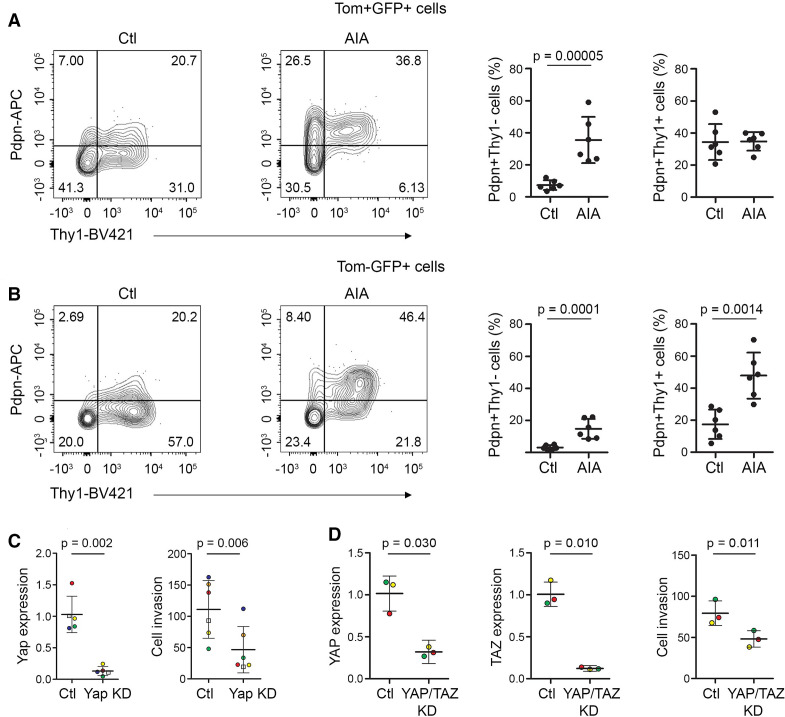
Phenotypic analysis of SF in inflammatory arthritis. (A, B) Freshly isolated cells from knees of adult Gdf5-Cre;Tom;Pdgfrα-H2BGFP mice 6 days after AIA induction (n=6; 5 male mice and one female mouse, 11–14 weeks, pooled data from two experiments) were analysed by flow cytometry for the expression of Pdpn and Thy1 within (A) the Gdf5-lineage Pdgfrα-expressing cells (Tom+GFP+) and (B) the remaining Pdgfrα-expressing cells (Tom-GFP+). The contralateral knees served as controls. Graphs show the percentage of cells expressing Pdpn with or without coexpression of Thy1. P values indicate statistical significance based on unpaired two-tailed t-test after log transformation. For gating strategy and staining controls, see online supplemental figure 2. (C) Yap KD decreased AIA-SF invasiveness through matrigel in a transwell assay. Dots are colour-coded to indicate different experiments (n=5 for Yap expression, n=6 for cell invasion) using cells from three different mice for DsiRNA#1 (circles), and from a fourth mouse for DsiRNA#2 (squares). P values indicate results of two-tailed paired Student’s t-test. (D) YAP/TAZ KD decreased human RA-SF invasiveness through matrigel in a transwell assay. Dots are colour-coded to indicate independent experiments using cells from different donors (n=3). P values indicate results of two-tailed paired Student’s t-test. AIA, antigen-induced arthritis; KD, knockdown; Pdpn, podoplanin; RA, rheumatoid arthritis; SF, synovial fibroblast; Thy1, Thy-1 cell surface antigen.

