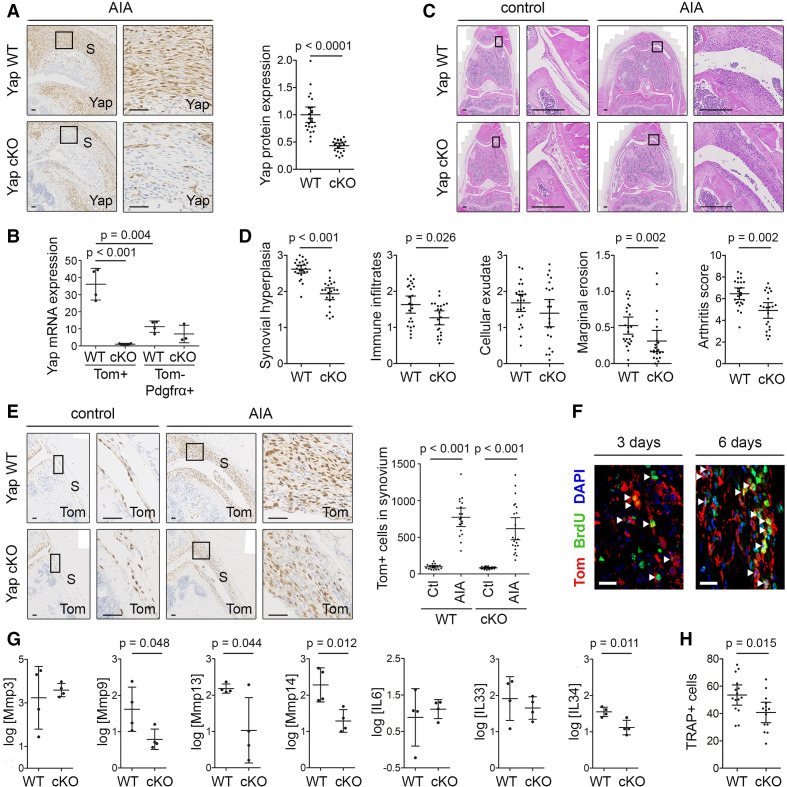
Figure 5.
Ablation of Yap in Gdf5-lineage cells reduces inflammatory arthritis severity. AIA was induced in one knee of Yap WT or Yap cKO mice, with contralateral knee serving as control, and mice were analysed after 3 or 6 days (F), 7 days (B, G) or 9 days (A, C–E, H). See online supplemental table 2 for mouse genotypes, sex, age and exclusions. (A) Yap expression in inflamed synovium detected by IHC. Images show mice with highest arthritis score in their group. Scale bars: 50 µm. P value: unpaired two-tailed t-test after log transformation (WT: n=24; cKO: n=22; five experiments). (B) Yap mRNA expression detected by qRT-PCR in fluorescence-activated cell sorting (FACS)-sorted SF from AIA knees of Yap WT (n=4) and Yap cKO mice (n=3–4; 1 Yap cKO Tom-Pdgfrα+ sorted sample was excluded from analysis due to very low cell yield). P values indicate results of two-way analysis of variance with Tukey’s post-test after log transformation. (C, D) H&E staining and histological scoring of arthritis severity. Images show matched control and AIA knees from mice with arthritis scores (WT: 6.33; cKO: 4.66) close to their group average. Scale bars: 200 µm. P values: Mann-Whitney U test (WT: n=24; cKO: n=22; five experiments). (E) Tom+ Gdf5-lineage cells in synovium detected by IHC. Images are from the same mice as in (C). Scale bars: 50 µm. Graph shows Tom+ cells per millimetre length of synovium. P values: Kruskal-Wallis test with Dunn’s post-test (WT: n=18; cKO: n=22; five experiments). (F) Immunofluorescent detection of BrdU (green) in Tom+ Gdf5-lineage cells (red) in the synovium of Yap cKO mice at 3 (n=5) or 6 days (n=3) after AIA induction. Scale bars: 20 µm. (G) Expression of Mmps and cytokines detected by qRT-PCR in Gdf5-lineage cells FACS-sorted from knees of Yap WT (n=4) or Yap cKO (n=4) mice. P values: unpaired two-tailed t-test after log transformation. (H) TRAP+ cells along the medial and lateral femoral periosteal surface of female mice. P value: unpaired two-tailed t-test (WT: n=15; cKO: n=14; five experiments). Boxed areas in images on the left are shown at higher magnification on the right. For isotype negative control stainings, see online supplemental figure 10e, f, j. For FACS strategy, see online supplemental figure 4. Data on graphs are shown as mean±95% CI (A, D, E, H) or mean±SD (B, G). AIA, antigen-induced arthritis; S, synovium; SF, synovial fibroblast; WT, wild type; Yap, Yes-associated protein.

