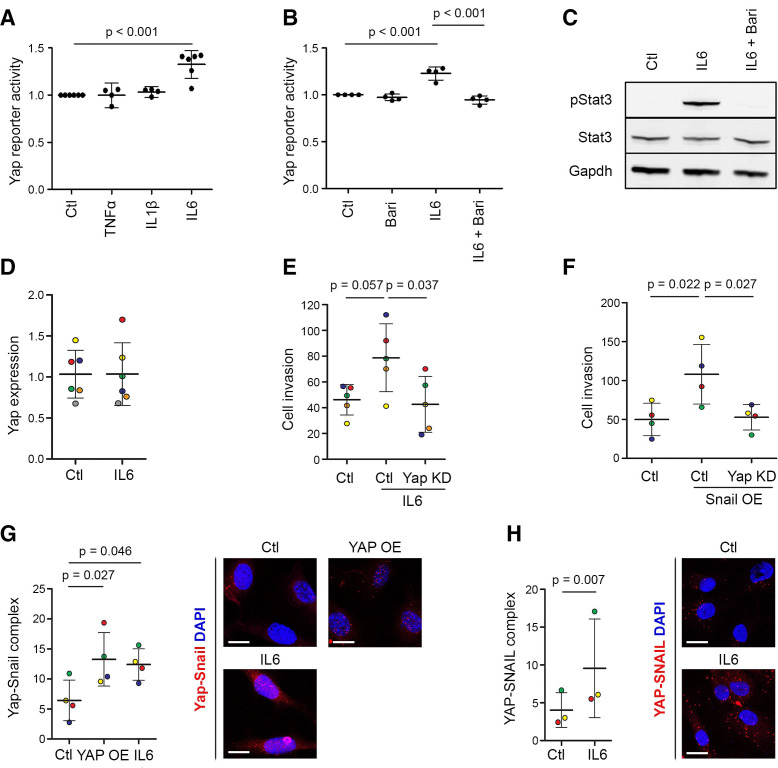
Figure 7.
IL-6 activates Yap through Jak and drives SF invasion by stimulating Yap–Snail interaction. (A) IL-6 activates Yap. Yap–Tead GFP reporter cells were stimulated with 10 ng/mL TNF-α, 10 ng/mL IL-1β or 20 ng/mL IL-6/sIL6R, and GFP expression was quantified by flow cytometry (n=4–6 experiments). P value: one-way repeated measures ANOVA with Tukey’s post-test, performed on data before normalisation. (B) The Jak inhibitor baricitinib prevents IL-6-induced Yap activation. Yap–Tead GFP reporter cells were treated with IL-6/sIL6R (20 ng/mL) and baricitinib (1 or 2 µM) for 48 hours under vehicle-controlled conditions, and GFP expression was quantified by flow cytometry (n=4 experiments). P values: one-way repeated measures ANOVA with Tukey’s post-test, performed on data before normalisation. (C) Baricitinib prevents IL-6/sIL6R-induced Stat3 phosphorylation. Yap–Tead GFP reporter cells were pretreated for 1 hour with baricitinib (10 µM) and then treated with IL-6/sIL6R (140 ng/mL) for 30 min, as indicated, under vehicle-controlled conditions. Data are representative of n=3 experiments. See online supplemental figure 11 for uncropped Western blot images. (D) IL-6/sIL6R treatment (10 ng/mL) does not affect Yap mRNA expression in AIA-SF after 24 hours. (E) Yap KD prevents the increased AIA-SF invasiveness after IL-6/sIL6R treatment (10 ng/mL) for 48 hours. Dots are colour-coded to indicate five independent experiments using cells from four different mice. P values: one-way repeated measures ANOVA with Tukey’s post-test. (F) Yap KD prevents the increased invasion of AIA-SF induced by Snail overexpression. Dots are colour-coded to indicate four independent experiments using cells from three different mice. P values: one-way repeated measures ANOVA with Tukey’s post-test. (G) Treatment with IL-6/sIL6R (5 ng/mL) for 4 hours increased Yap–Snail complex formation in mouse SF, detected using proximity ligation assay. Transfection with constitutively active YAP-S127A was used as a positive control. Dots are colour-coded to indicate independent experiments using cells from different mice (n=4). P values: repeated measures one-way ANOVA with Dunnet’s post-test. Scale bars: 20 µm. (H) Treatment with IL-6/sIL6R (5 ng/mL) for 4 hours increased YAP–SNAIL complex formation in human SF, detected using proximity ligation assay. Dots are colour-coded to indicate independent experiments using cells from different donors (n=3). P value: two-tailed paired Student’s t-test. Scale bars: 20 µm. Lines and error bars on all graphs indicate mean±SD. ANOVA, analysis of variance; IL, interleukin; KD, knockdown; OE, overexpression; SF, synovial fibroblast; Yap, Yes-associated protein.

