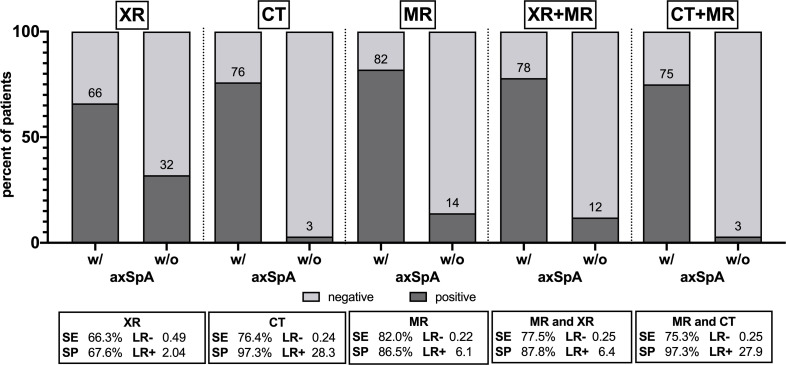
Figure 2.
Frequency of positive and negative findings in radiography (XR), CT, MRI and combinations with resulting diagnostic accuracy values. Numbers are percentages of positive imaging results in patients with and without axSpA. axSpA, axial spondyloarthritis; LR−/+, negative/positive likelihood ratio; SE, sensitivity; SP, specificity.

