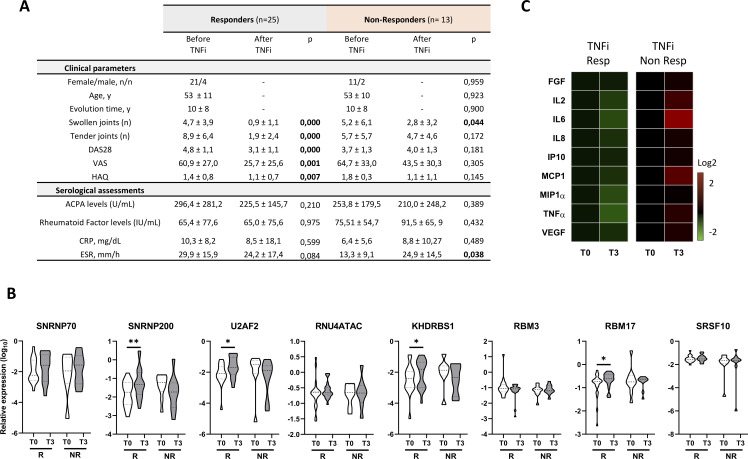
Figure 4.
Anti-TNF therapy reverse the altered spliceosome signature of lymphocytes along with the inflammatory and clinical profile of patients with RA. (A) Table showing clinical and serological characteristics of 38 patients with RA before and after 3 months of TNFi therapy. Data are divided in responders and non-responders based on European League Against Rheumatism guidelines. (B) Heat map showing levels of circulating inflammatory molecules in plasma of patients with RA before and after 3 months of TNFi therapy. Levels of inflammatory molecules are expressed as log 2 and normalised to time 0 (T0), before therapy, in responders and non-responders’ patients with RA. (C) Violin plots representing the expression distribution of the eight spliceosome components in lymphocytes before and after 3 months of TNFi therapy in responders and non-responders’ patients with RA. *p<0.05, **p<0.01. ACPAs, anti-citrullinated protein antibodies; CRP, C-reactive protein; DAS28, disease activity score-28; ESR, erythrocyte sedimentation rate; FGF, fibroblast growth factor; HAQ, health assessment questionnaire; IL, interleukin; IP, interferon gamma-induced protein; MCP, monocyte chemoattractant protein; MIP, macrophage inflammatory protein; R, responders, patients with RA; NR, non-responders, patients with RA; TNF, tumour necrosis factor; TNFi, TNF inhibitor; T0, time before TNFi therapy; T3, time 3 months after TNFi therapy; VAS, visual analogue scale; VEGF, vascular endothelial growth factor; Y, years.

