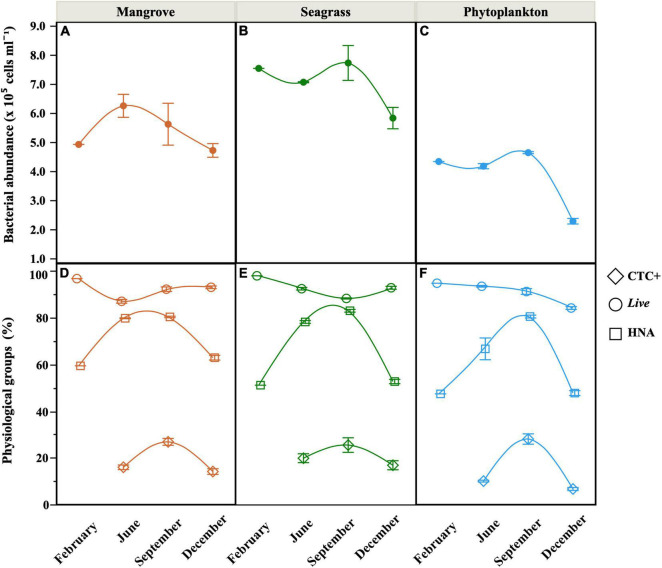
FIGURE 4.
Seasonal distribution of mean (± SE) values of total heterotrophic bacterial abundance (A–C), sum of LNA and HNA cells) and the contribution of Live, HNA and CTC+ cells (D–F) at the onset of the incubations (unfiltered seawater, equivalent to the Community treatment) at the three sites. Smooth fitting joins site points for clarity.

