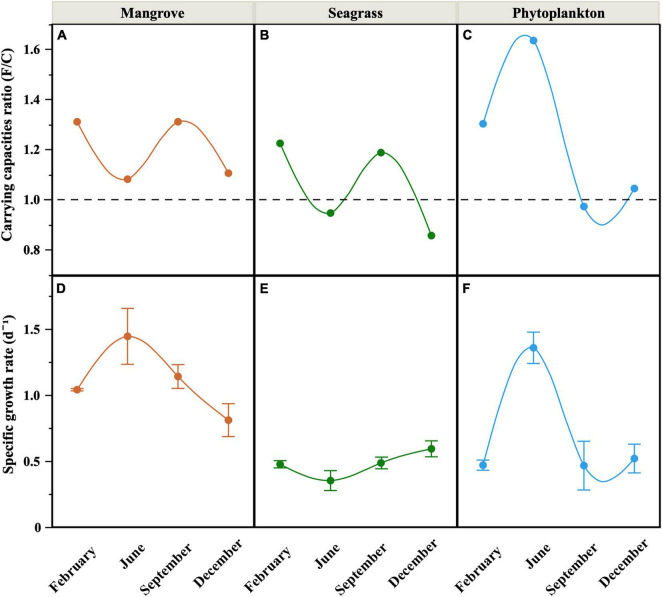
FIGURE 5.
Seasonal distribution of the ratio between the carrying capacities of the Filtered and the Community treatments (A–C) and mean (± SE) specific growth rates of heterotrophic bacteria in the Filtered treatment (D–F) at the three sites. Smooth fitting joins site points for clarity. Dashed line in (A–C) represents the 1 value (i.e., no difference between the maximum bacterial abundances of both treatments).

