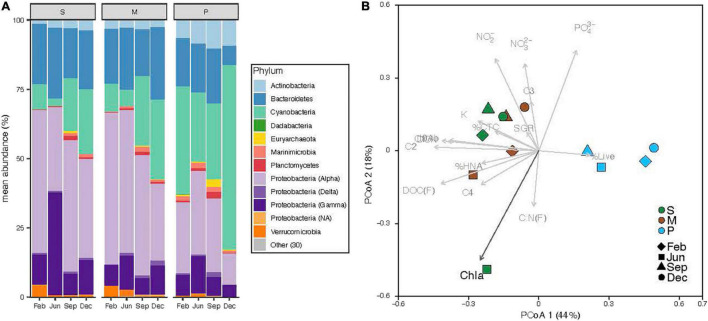
FIGURE 7.
Prokaryotic diversity at the time of sample collection at the three sites (S, Seagrass; M, Mangrove; P, Phytoplankton), showing the relative abundance of sequences belonging to the top 10 most abundant phyla, with Proteobacteria further divided into its major classes (A) and distribution of samples according to Principal Coordinates Analysis of Bray–Curtis distances with biological and environmental variables overlaid (B). Black arrows show significant effects (p > 0.05).

