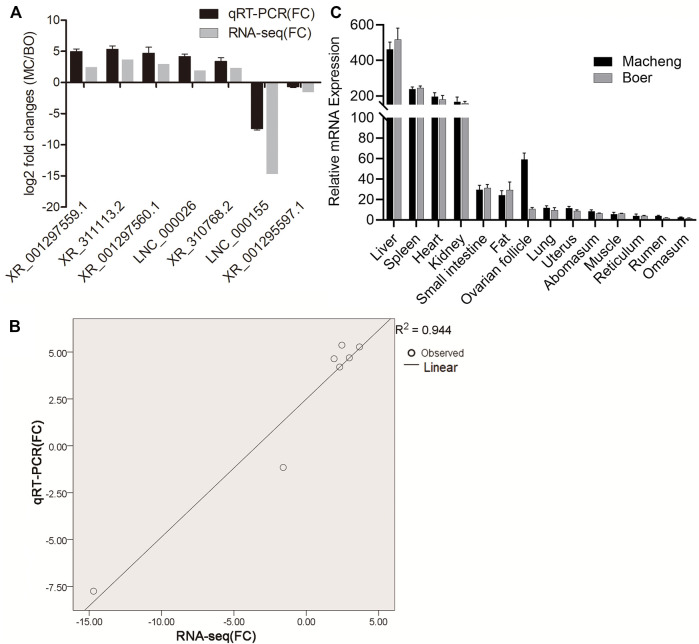
FIGURE 3.
Validation of selected lncRNAs and mRNAs using qRT-PCR. (A) Fold changes in the relative expression of lncRNAs, as assessed by qRT-PCR. Results of the comparison of the seven lncRNAs using qRT-PCR and RNA‐seq. The vertical axis indicates the mean fold change (log2-fold change) of each lncRNA. (B) Correlation analysis of the fold changes between qRT-PCR and RNA-seq. (C) Relative expression of lncRNAs. Expression profile of lncRNA XR_311113.2 in 14 tissues of Macheng and Boer goat expressed as the mean ± SD. Data were normalized to the reference gene (β-actin).

