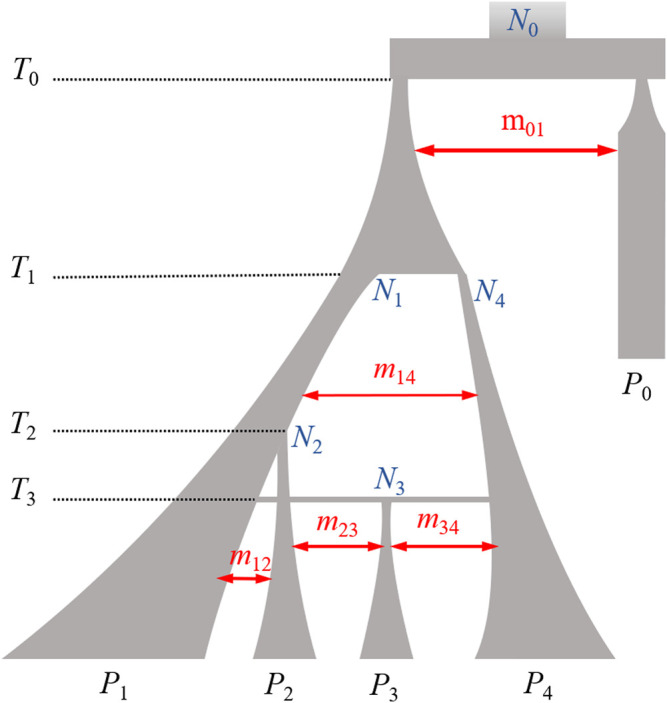
FIGURE 1.

Illustration of the simulation demographic model. Branch width corresponding to population size and time flowing from the top to the bottom. The width of the double arrows is proportional to the migration intensity. T i, number of generations back to the population history event; N j, effective population size of P j population; m xy, migration rate between P x and P y. Model details are provided in Table 1 and Supplementary Text S1.
