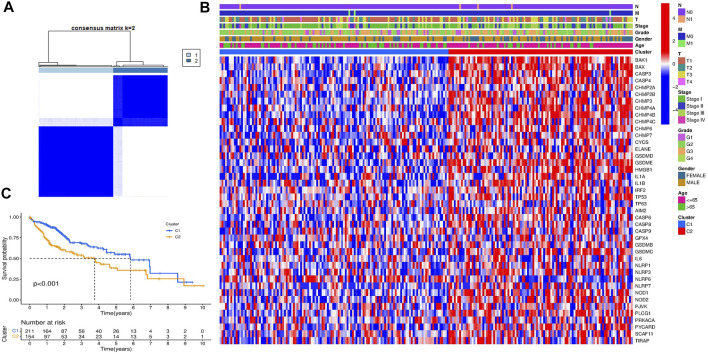
FIGURE 3.
HCC classification pattern based on the pyroptosis-related DEGs. (A) 377 HCC patients were divided into two groups when k = 2 in the TCGA cohort. (B) Heatmap of the clinicopathological characteristics between the two clusters classified by the DEGs. (C) KM overall survival curves of the two clusters.

