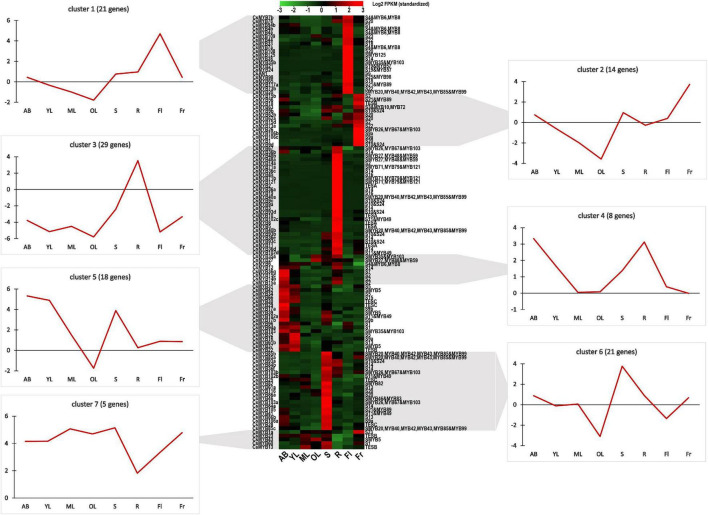
FIGURE 2.
Heatmap of the 118 CsR2R3-MYB genes transcribed in the tissues of C. sinensis. The 118 CsR2R3-MYB genes clustered into seven expression groups, based on their tissue-specific expression. The gene name is indicated on the left of the heatmap, and the short name of the phylogenetic subgroup is on the right. Transcript abundance is expressed in standardized log2 fragments per kilobase of exon per million fragments mapped (FPKM) values. Next to each RNA-seq-based cluster, there is a graph with the mean transcript abundance for the entire cluster in each tissue. AB, apical bud; YL, young leaf; ML, mature leaf; OL, old leaf; S, stem; R, root; Fl, flower; Fr, fruit. Data were obtained from the Tea Plant Information Archive (http://tpia.teaplant.org/).

