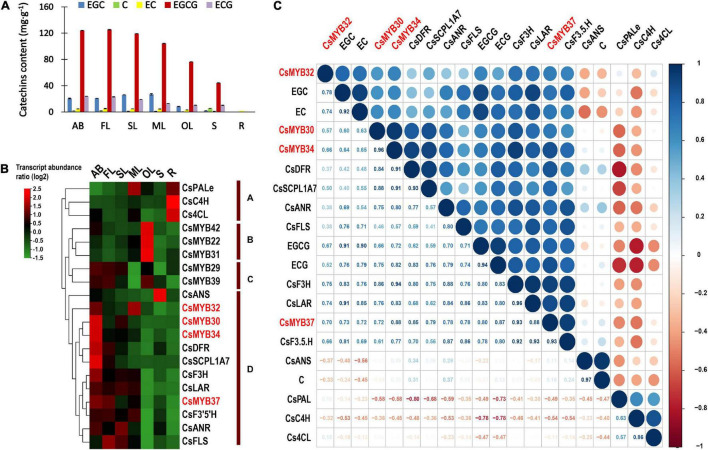
FIGURE 4.
Expression profiling validation and correlation analysis. (A) The contents of six catechin monomers in seven tissues as measured with an HPLC system. (B) Heatmap of qRT-PCR transcript abundance patterns in seven different tissues. (C) Correlative analysis of four potential CsR2R3-MYB TFs, catechin biosynthesis genes and catechin accumulation patterns in different tissues of tea plants. R > 0.5, positive correlation; R < –0.5, negative correlation. AB, apical bud; YL, young leaf; SL, second leaf; ML, mature leaf; OL, old leaf; S, stem; R, root.

