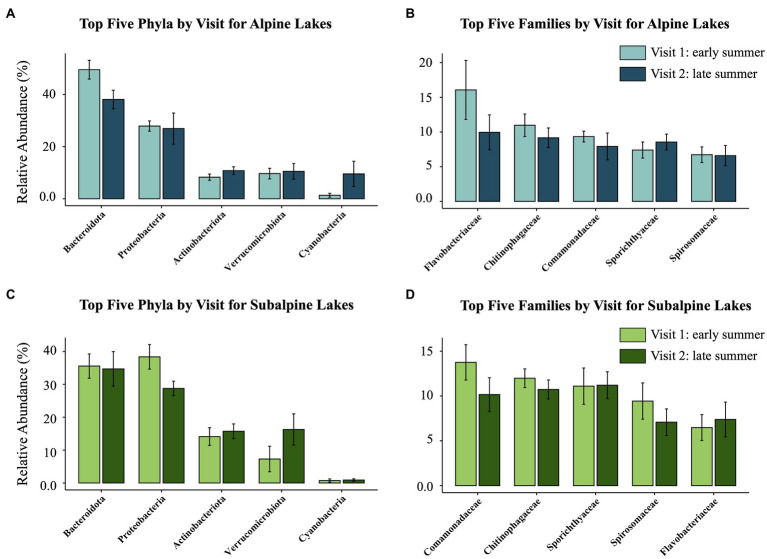
Figure 3.
The relative abundance of the top five most abundant taxa compared between the early summer (Visit 1) and late summer (Visit 2) visits for both alpine (blue, above) and subalpine (green, below) lakes. The two figures on the left (A,C) represent the top five phyla, and the two figures on the right (B,D) represent the top five families for each lake type (alpine or subalpine).

