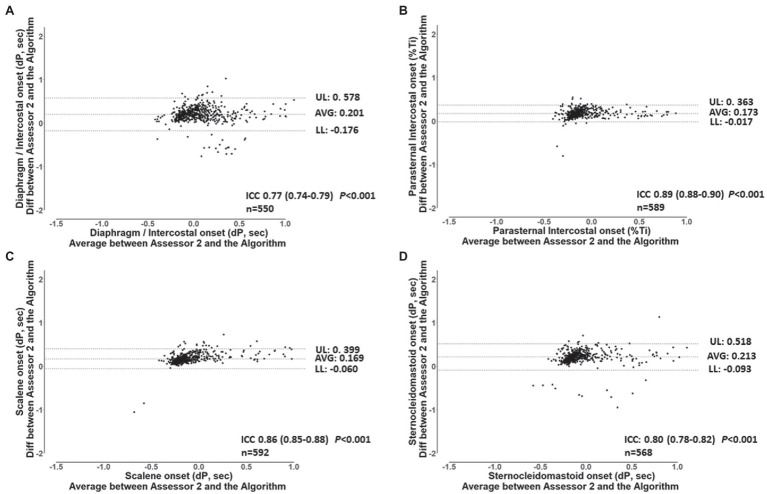
Figure 5.
Bland and Altman plots and ICC’s values for the breath-by-breath detection of dP of EMG, onset by assessor 1, and the algorithm for the diaphragm/intercostal (A), parasternal intercostal (B), scalene (C), and sternocleidomastoid (D). AVG: average bias between the results from both assessors. UL and LL: 95% confidence interval of the difference between the results from both assessors. n: number of EMG, onset analyzed. dP: phased difference between the onset of the electrical activity of the muscle and the start of the inspiration calculated (see text for further details).

