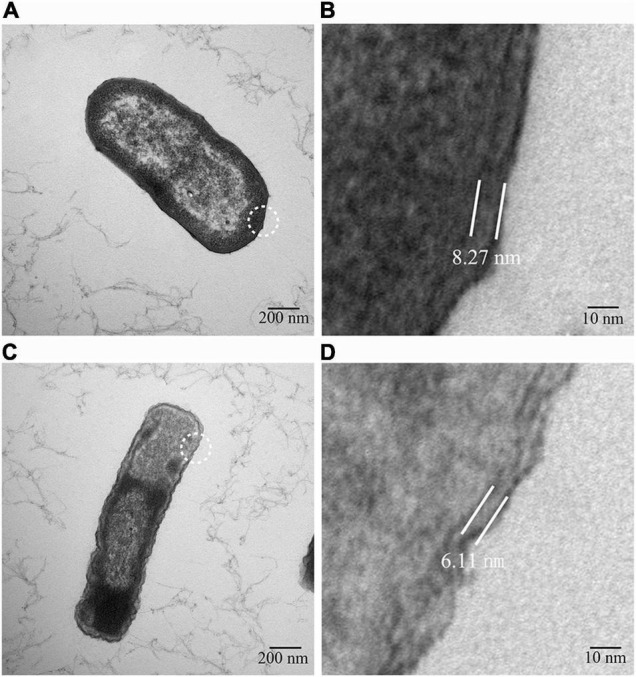
FIGURE 2.

Transmission electron micrograph. (A) Strain morphology of the WT strain. (B) Cell wall thickness of the WT strain. (C) Strain morphology of the cefiderocol-treated strain. (D) Cell wall thickness of the WT strain of the cefiderocol-treated strain. (B,D) Are the enlarged images in the white circles of (A,C), respectively. The cell wall thickness of the WT strain was about 8.72 nm, while that of the cefiderocol-treated strain was about 6.11 nm.
