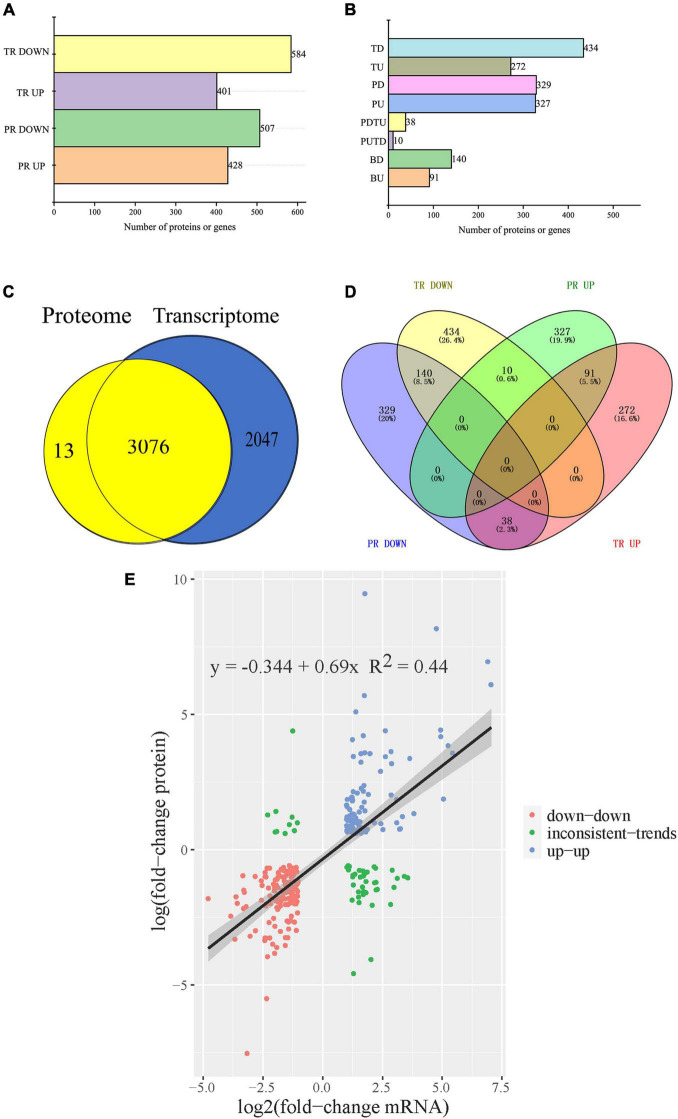
FIGURE 6.
Integration analysis of proteome and transcriptome. (A) The profile of differentially transcribed genes (DEGs) and differentially expressed proteins (DEPs) of cefiderocol-treated strains compared with the WT strains. (B) The classification of DEGs and DEPs. (C) Comparison of the number of identified transcripts and proteins. (D) Venn diagram of the number of DEPs and DEGs in proteomics and transcriptome. (E) Scatter plot of genes and its corresponding proteins expression in cefiderocol-treated strains vs. the WT strains. BU, transcript level and protein level both up-regulated. PUTD, transcript level down-regulated and protein level up-regulated. TU, transcript level up-regulated and protein level not regulated. PU, transcript level normal and protein level up-regulated. PDTU, transcript level up-regulated and protein level down-regulated. BD, transcript level and protein level both down-regulated. TD, transcript level down-regulated and protein level not regulated. PD, transcript level normal and protein level down-regulated. PR, proteomics. TR, transcriptomics.

