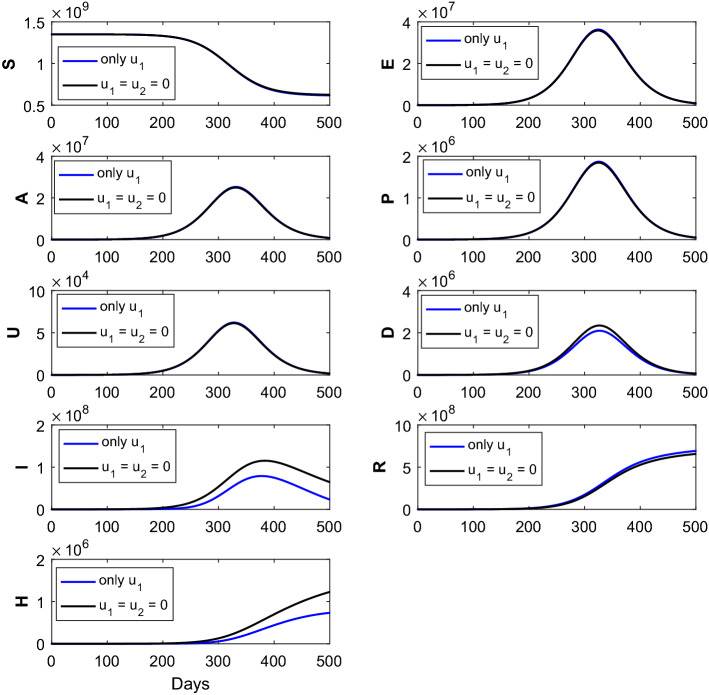
Fig. 3.
The figure represents the comparison of the corresponding susceptible (S), exposed (E), asymptomatic (A), pre-symptomatic (P), symptomatic undetected (U), clinically ill or symptomatic detected (D), isolated or hospitalized (I), recovered (R) and dead (H) classes without intervention strategies, with the implementation of intervention strategies (only control). Optimal treatment strategy (solid blue line) demonstrates reduction of the (D), (I) and (H) classes and increase in the (R) class when compared with the no controls (solid black curves). The parameter values are given in Table 1

