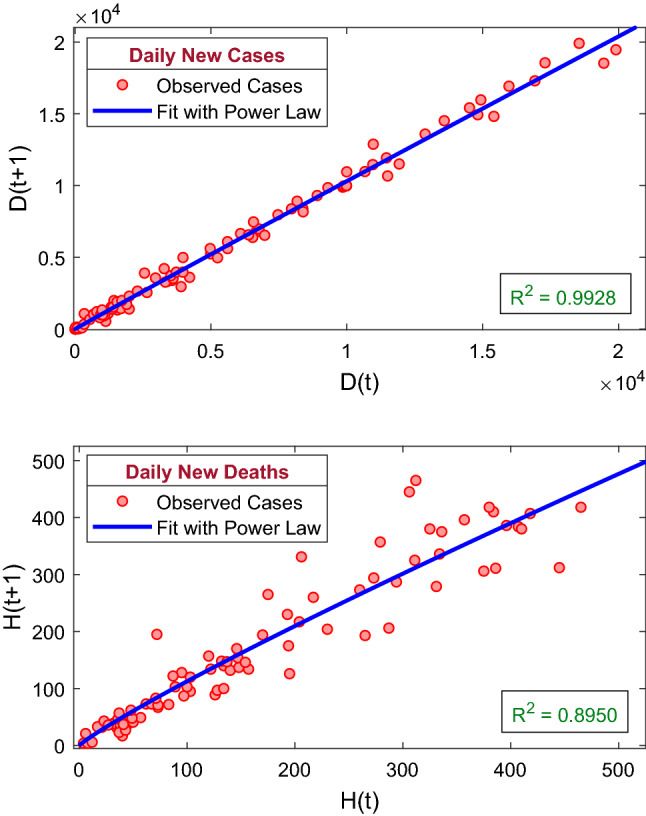
Fig. 9.

The figure represents the recurrence plots for the daily new COVID-19 cases and the daily new deaths due to COVID-19 infection. The best fit of the power law of the kind (18) is shown by solid blue curve. The coefficient of determination for the daily new COVID-19 cases is 0.9928, and the coefficient of determination for the daily new deaths is 0.8950. The best fit curves of the power law are increasing for both the populations
