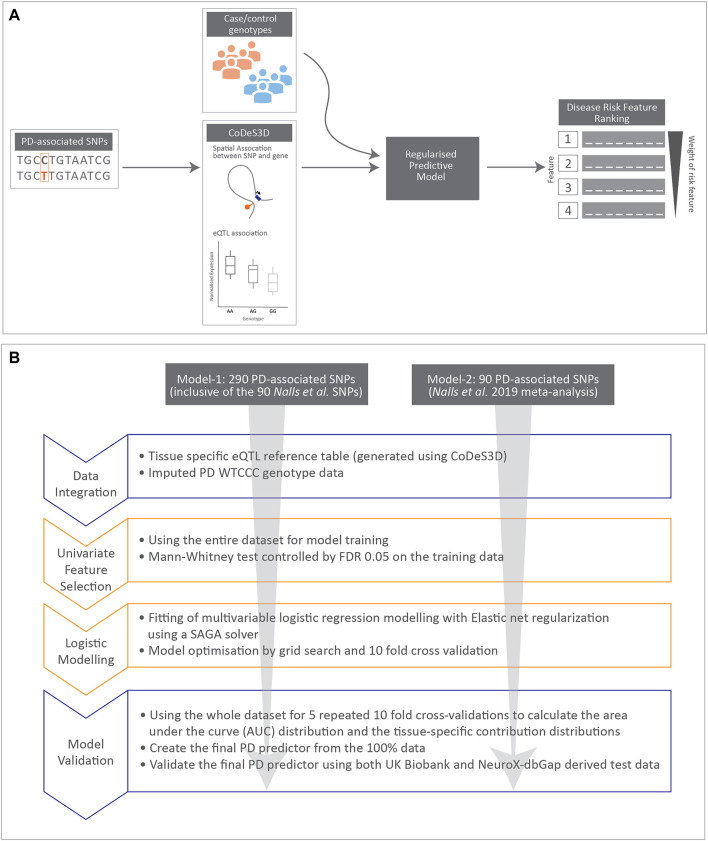
FIGURE 1.
Cartoon illustrating data integration and workflow for regularised logistic regression modelling undertaken in this manuscript. (A) Schematic diagram for data integration used to rank disease risk features. (B) Workflow used to create the two regularised logistic regression predictor models for PD.

