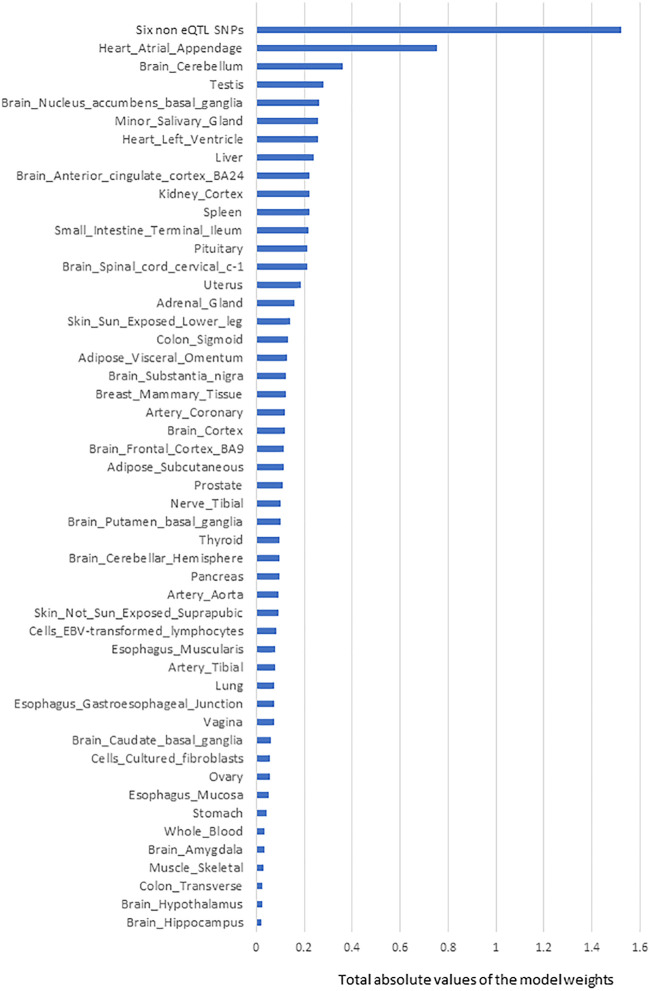
FIGURE 2.
The rank order of tissue-specific risk contributions to risk of developing PD calculated using model-1. Tissue PD risk contributions were the sum of the absolute values of the model weights (coefficients) of the features used in the logistic regression predictor (model-1) according to their tissues. The SNPs/eQTLs that contributed to each category are listed (Supplementary Table S5).

