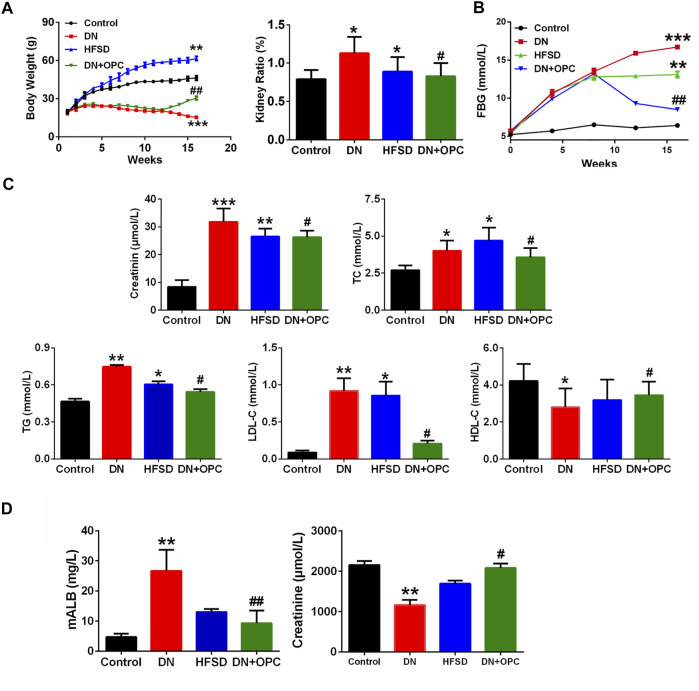
FIGURE 1.
Physiological and biochemical indexes (A) The body weight and kidney ratio in the different groups at week 16. kidney ratio equal to kidney weight/body weight. (B) FBG in the different groups. (C) Serum parameters in the different groups. Including serum creatine, TC contents, TG contents, LDL-C contents, and HDL-C contents in the different groups. (D) mALB contents and Urine creatinine in the different groups. *p < 0.05, **p < 0.01, ***p < 0.001 compared with control group; # p < 0.05, ## p < 0.01, compared with DN group.

