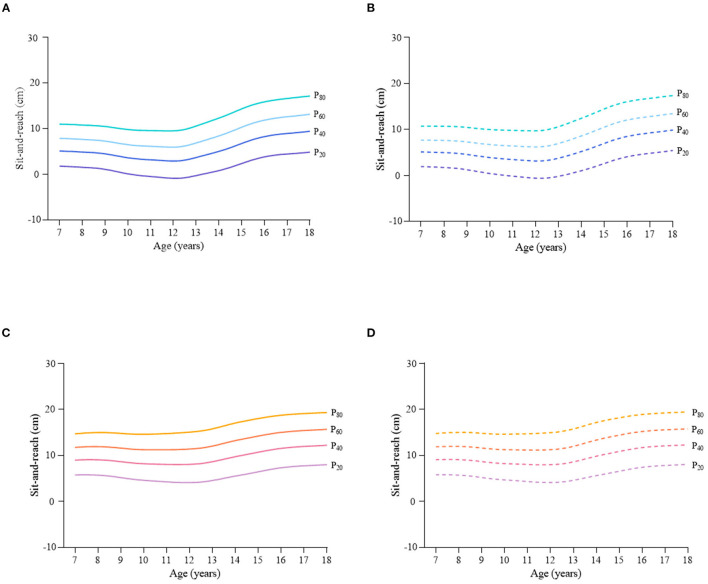
Figure 5.
Sex- and age-specific percentile curves (P20, P40, P60, and P80) for sit-and-reach (SR) (cm) for the Chinese children and adolescents aged 7–18 years based on total population and normal weight population. (A) Boys-Total population, (B) Boys-Normal weight population, (C) Girls-Total population, and (D) Girls-Normal weight population.

