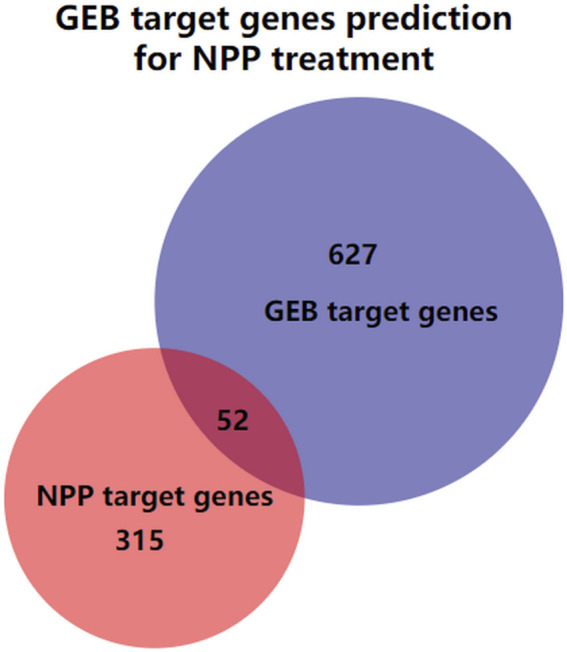
FIGURE 2.

The Venn diagram illustrating the intersection of the GEB target genes and NPP target genes. The blue circle is the GEB target genes, the red circle is the NPP target genes, and the overlap of the two circles indicates GEB target genes prediction for NPP treatment.
