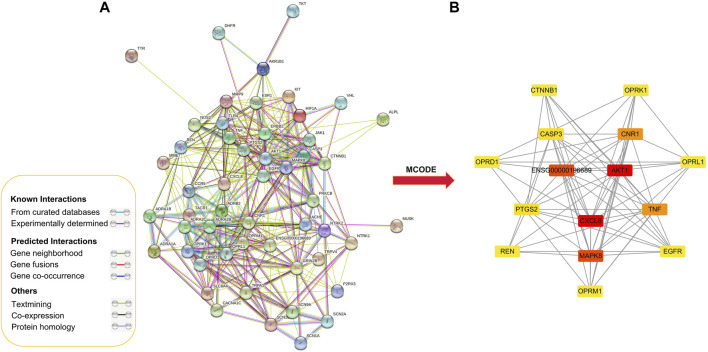
FIGURE 3.
Protein-protein interaction network for GEB in treatment for NPP. (A) Protein-protein interactions among the 52 core targets. Network nodes represent proteins, and edges represent protein-protein associations. (B) PPI network of the hub genes using MCODE plugin. The color from red/orange/yellow indicated the different importance of the nodes in the whole PPI network. That is, the redder the retangle is, the more important the node is in the PPI network.

