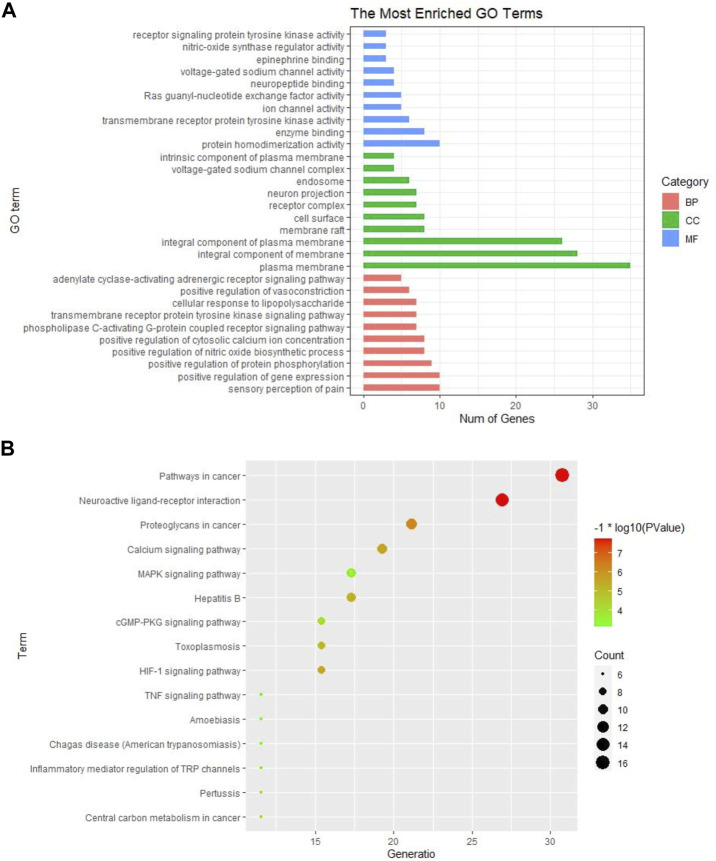
FIGURE 4.
GO and KEGG pathway enrichment analysis of GEB in treatment for NPP. (A) GO analysis of significant items of 52 common targets in different functional groups (BPs, CCs, MFs) (B) The top 15 KEGG pathways based on their p-values. The larger the circle, the greater the number of the target genes in the term. Also, color highlights the size of the FDR: the redder the color, the more significant the value.

