
FIGURE 9.
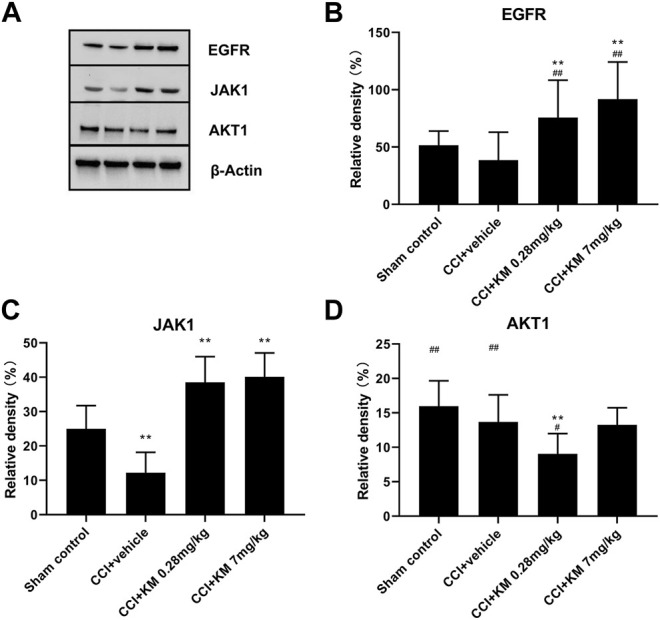
Western blot (A) and relative protein expression of EGFR (B), JAK1 (C), and AKT1 (D). The data are presented as the mean ± SD (n = 6) and were analyzed using two-way repeated analysis of variance (ANOVA) followed by Bonferroni’s post hoc test, ## p < 0.01 compared with the sham control group; ** p < 0.01 compared with the vehicle control group. KM, koumine.