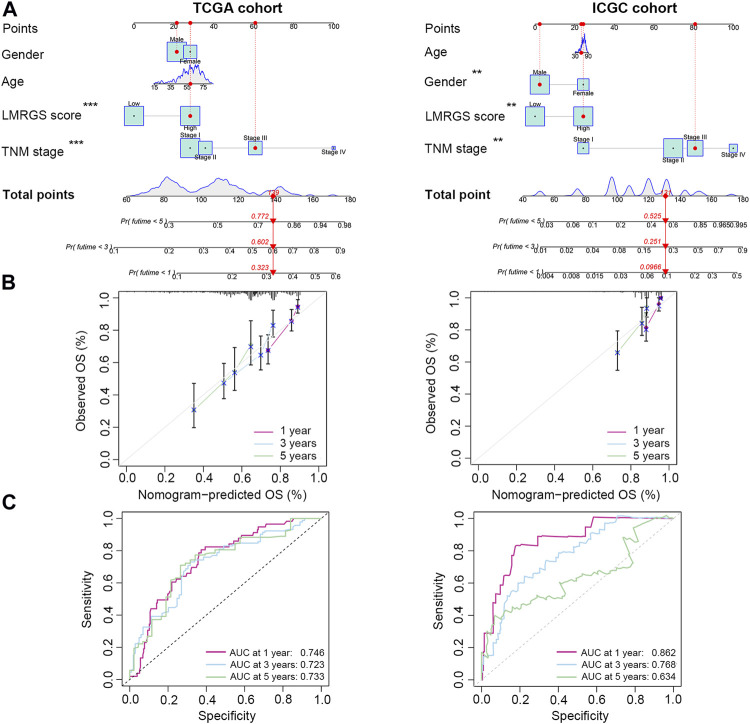
FIGURE 4.
A nomogram was generated to estimate the survival rate of HCC patients. (A) Development of a nomogram by combining LMRGS score with age, gender, and TNM stage to predict the survival probability. (B) Calibration plots of the nomogram. (C) ROC curves of the nomogram. *p < 0.05, **p < 0.01, ***p < 0.001.

