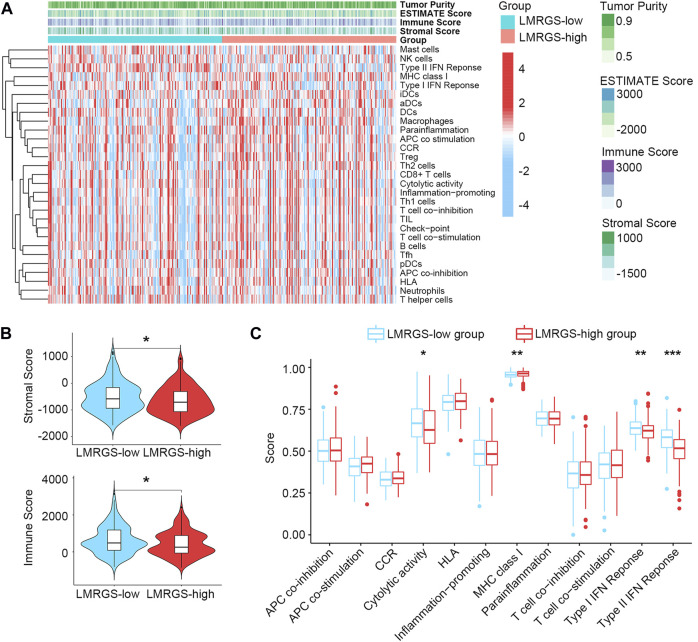
FIGURE 7.
The landscape of TME in HCC. (A) Stromal score and immune activity of all HCC samples. (B) The violin plot showed the difference in stromal scores and immune scores between LMRGS-low and LMRGS-high groups. (C) Differences in immune function between the two subgroups. *p < 0.05, **p < 0.01, ***p < 0.001.

