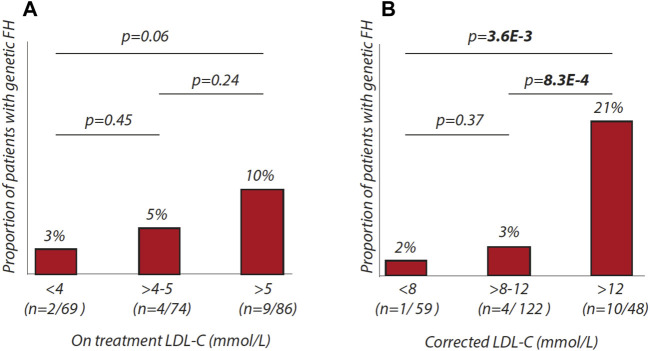
FIGURE 1.
Percentages of patients with genetic FH in different LDL-C ranges. (A) proportion of patients with genetic FH according to on-treatment LDL-C ranges (<4 mmol/L, > 4 to 5 mmol/L, > 5 mmol/L). (B) proportion of patients with genetic FH according to corrected-LDL-C ranges (<8 mmol/L, > 8 to 12 mmol/L, > 12 mmol/L).

