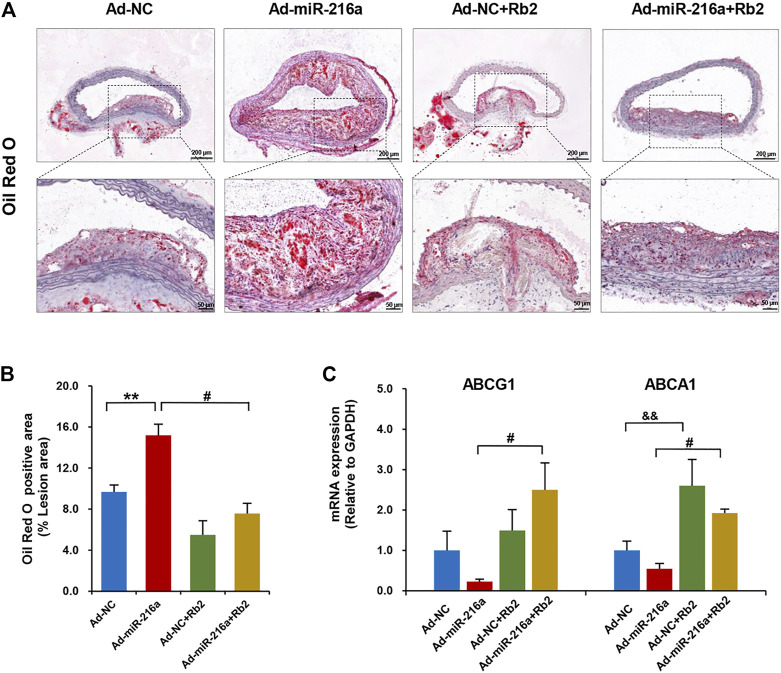
FIGURE 3.
Rb2 inhibited lipid accumulation in plaque and peritoneal macrophages of mice. (A) Representative image of Oil red O staining in the thoracic aorta from the Ad-NC group, Ad-miR-216a group, Ad-NC + Rb2 group, and Ad-miR-216a + Rb2 group. Scale bar = 200 μM or 50 μM. (B) Quantification of the percentage of lipid (of the total lesion area) in the thoracic aorta from the Ad-NC group, Ad-miR-216a group, Ad-NC + Rb2 group, and Ad-miR-216a + Rb2 group. (C) The mRNA expression of ABCG1 and ABCA1 of peritoneal macrophages from the Ad-NC group, Ad-miR-216a group, Ad-NC + Rb2 group, and Ad-miR-216a + Rb2 group. **p < 0.01, &&p < 0.01, compared to the Ad-NC group. #p < 0.05, compared to the Ad-miR-216a group. n = 5 for each group.

