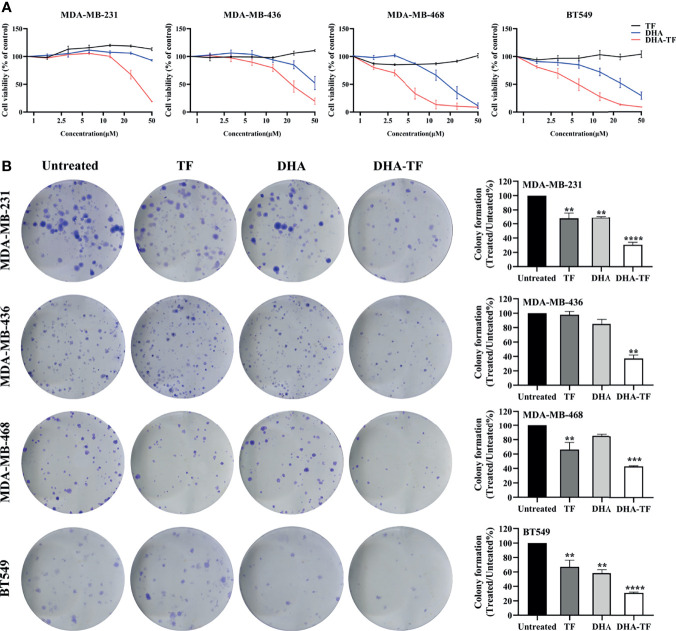
Figure 1.
DHA-TF adducts decrease cell viability compared with DHA in TNBC cell lines. (A) The sensitivity of MDA-MB-231, MDA-MB-436, MBA-MD-468, and BT549 to TF, DHA, or DHA-TF treatments. The cell viability was evaluated by MTS after cells had been exposed to different treatment options for 24 h. All the results were normalized to the untreated cells which is presented as 100% cell viability. (B) Clonogenic assay of DHA-TF for evaluation of long-term cell proliferation. TF, DHA, or DHA-TF was applied to MDA-MB-231 (15 µM), MDA-MB-436 (15 µM), MBA-MD-468 (5 µM), and BT549 (5 µM). Representative images are shown in the left panel, and the quantification of three independent experiments are shown in the right panel as bar graphs. Cells were stained and viable colonies were normalized to the number of colonies in untreated cells. Data shown are mean ± SEM from three independent experiments performed in triplicate. **0.001 < p ≤ 0.01, ***0.0001 < p ≤ 0.001, ****p ≤ 0.0001.

