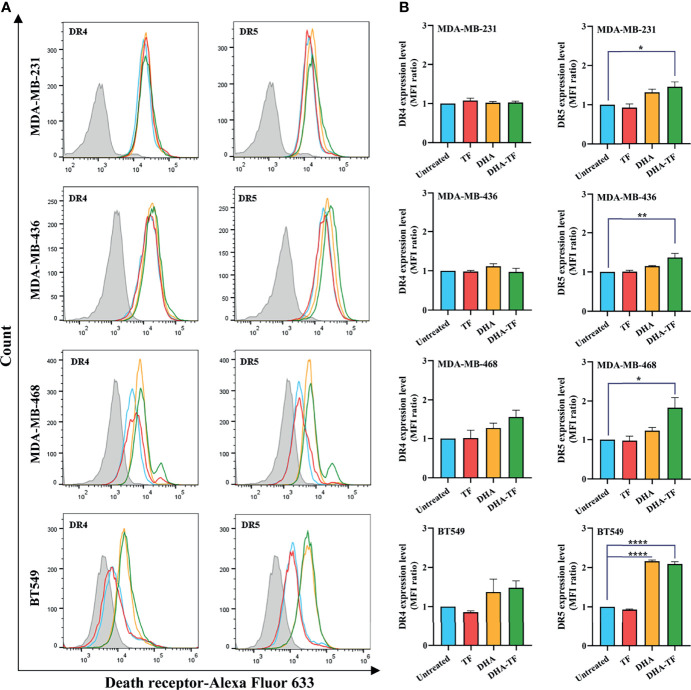
Figure 7.
DHA-TF significantly upregulates DR5 expression on the surface of TNBC cells. (A) TF, DHA, or DHA-TF were added to MDA-MB-231 (15 µM), MDA-MB-436 (15 µM), MBA-MD-468 (5 µM), and BT549 (5 µM) for 24 h. The histograms of death receptors expression were analyzed using FlowJo v10 software. (B) The mean fluorescence intensity (MFI) ratio relative to unstained cells (filled grey peaks) is shown in bar graphs. Data shown are mean ± SEM from three independent experiments. *0.01 < p ≤ 0.05, **0.001 < p ≤ 0.01, ****p ≤ 0.0001.

